
Knowledge Base
Help Center articles
System Health: uptime and the connection log
System Health shows how reliably your accounts have been reporting, and lists every connection problem: when it started and how long it lasted. Use it to spot a terminal or VPS that keeps dropping out.
Plan: every plan.
Open System Health
- Click Monitoring in the rail on the left.
- Click System Health in the menu.
Check your uptime
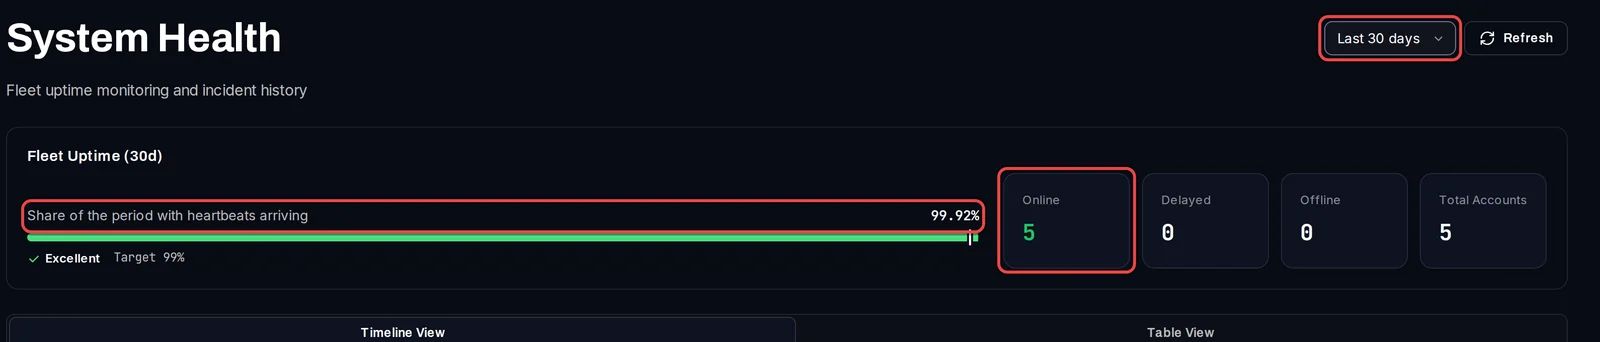
- At the top right, pick the period: Last 7 days, Last 30 days or Last 90 days.
- Read Share of the period with heartbeats arriving: the share of the time your accounts were sending updates. 99% or more is Excellent, from 95% Good, below that Needs Attention.
- Beside it, Online, Delayed and Offline count your accounts right now. Delayed means no update for 10 minutes, offline for 30 minutes.
Read the incident timeline
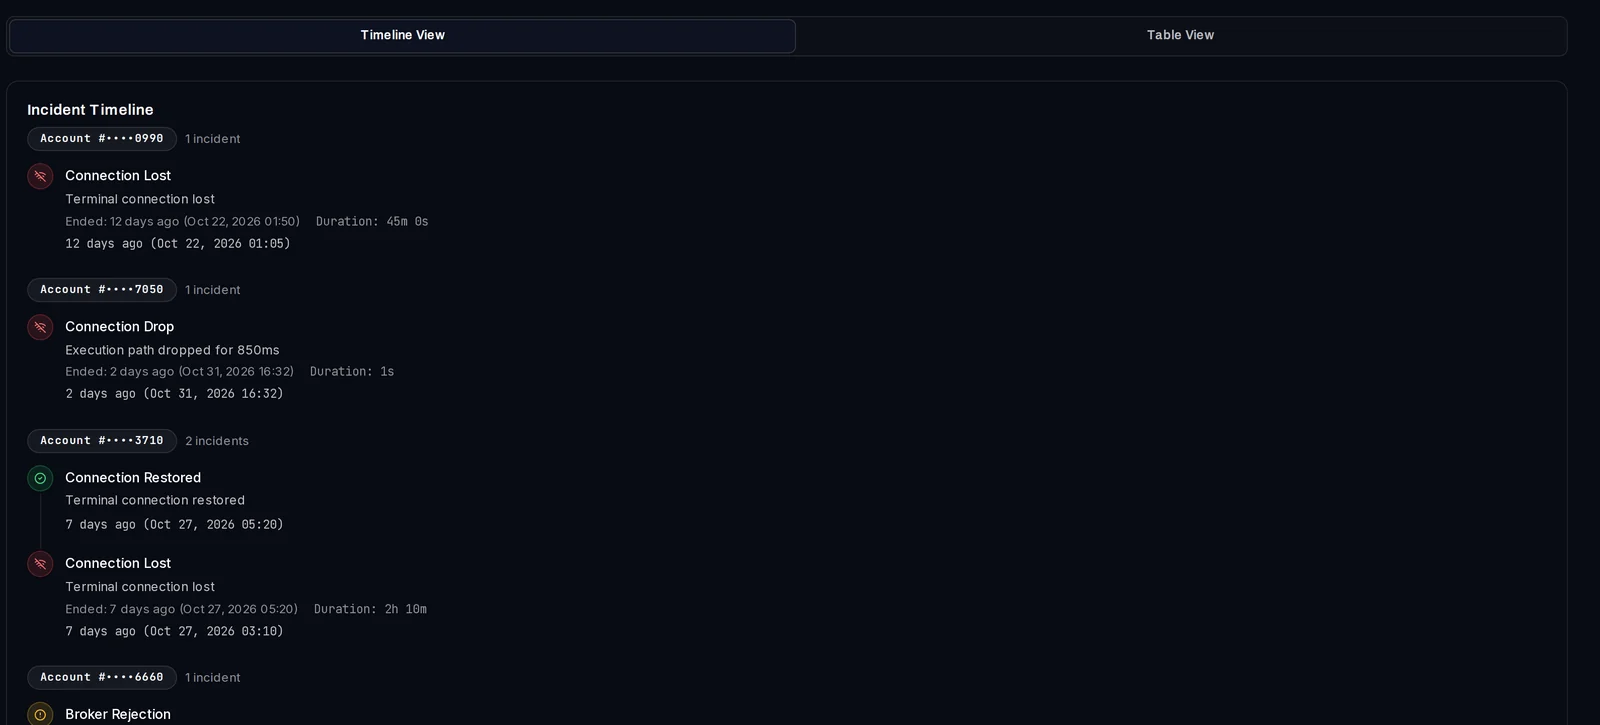
Timeline View groups the incidents by account number, each account's newest first, with when each one started, when it ended and how long it lasted:
- Connection Lost: the terminal lost its connection or stopped reporting.
- Connection Drop: the connection dropped briefly.
- Connection Restored: the terminal was back.
- Broker Rejection: the broker refused an order, with the reason, for example Off quotes.
Search and export the incidents
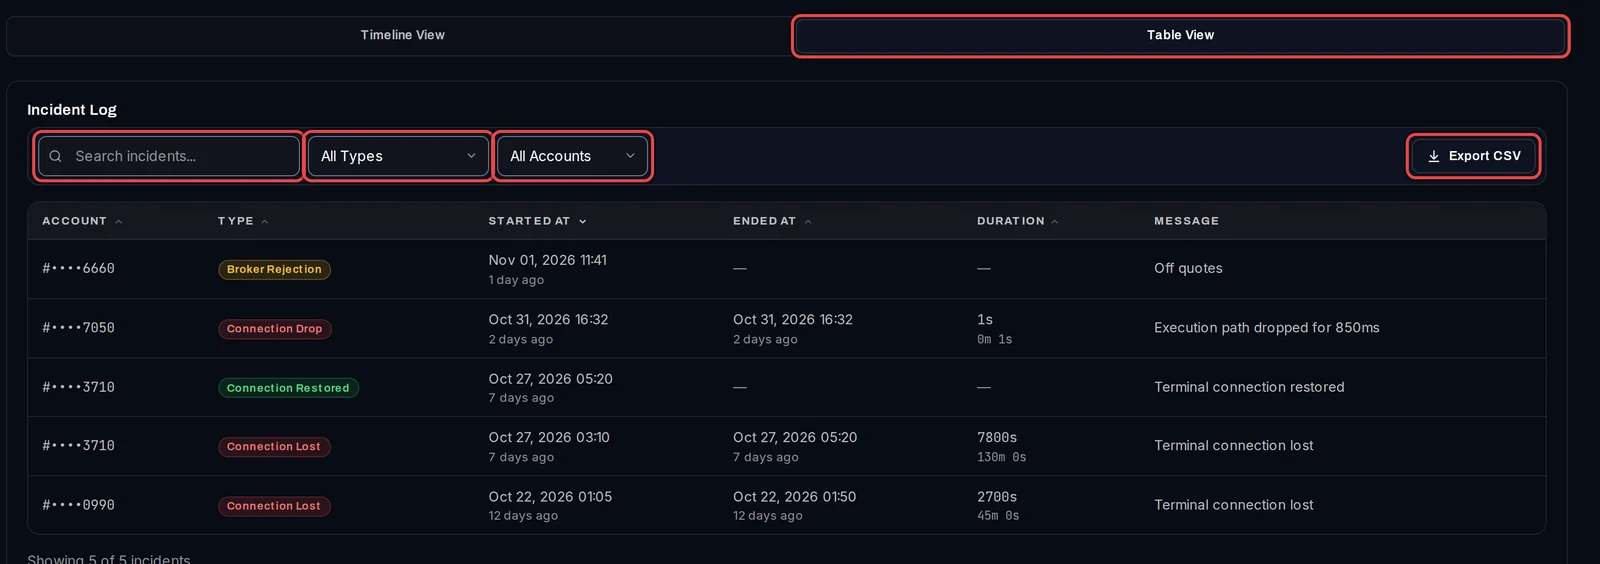
- Click Table View.
- Type in Search incidents..., or pick a type under All Types and an account under All Accounts.
- Click a column heading to sort by it.
- Click Export CSV to download the rows you see as a spreadsheet file.
Good to know
- The page reloads by itself every minute. Refresh reloads it now.
- Incidents are listed by account number, not robot name, and the privacy eye does not hide them.
- In the CSV file, durations are in seconds.
- To be told when a terminal goes offline, use the built-in alert for terminals going offline and coming back.