
Knowledge Base
Help Center articles
Read an account page
Every account has its own page: its figures, its equity curve, every trade and your notes. This guide shows where each thing is, so you know where to look first.
Plan: every plan. The Drawdown DNA, Backtest Comparison and Incidents tabs are part of Pro or VIP; the 14 days of Pro every new user starts with include them.
Open an account
- On the Overview, or in any list, click the account's name.
- At the top you see the robot name, the account number, its risk level (for example Healthy) and its account type. The share button beside them creates a public link.
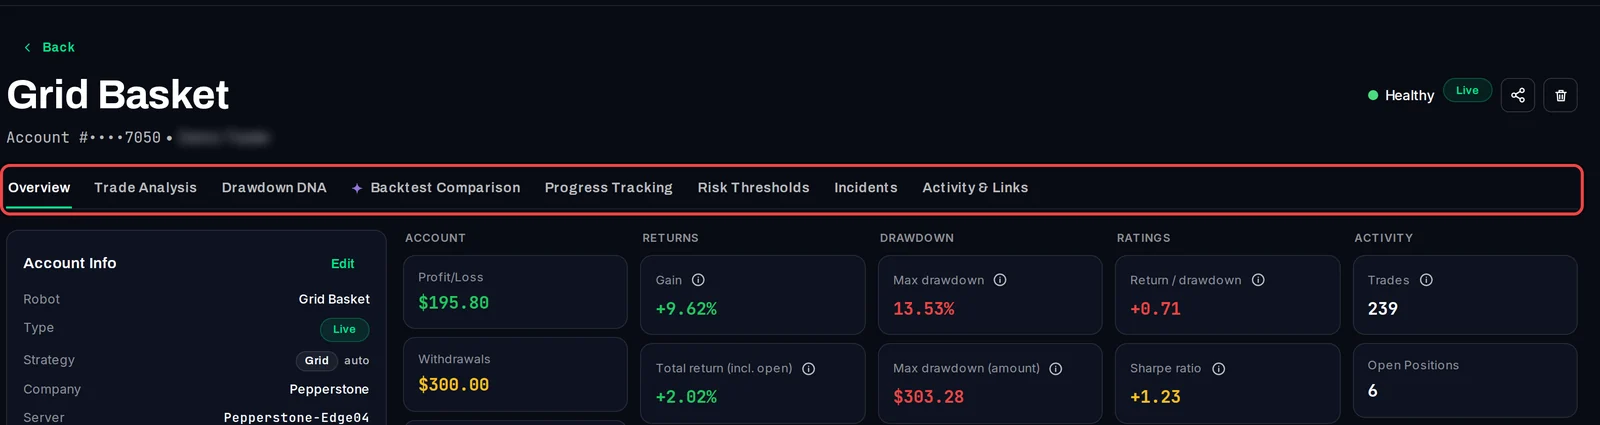
Find the right tab
- Overview: the account's figures, the equity chart, the Performance Summary and the Terminal with its trades.
- Trade Analysis: results per robot, by hour and day, by symbol and more.
- Drawdown DNA: every drawdown (a fall from a previous high), how deep it went and how long it took to recover.
- Backtest Comparison: your backtest next to the live results.
- Progress Tracking: prop-firm rules such as a profit target and a daily loss limit.
- Risk Thresholds: risk limits for this account only.
- Incidents: connection drops of the last 30 days.
- Activity & Links: last update, last trade, the robot's link and your notes.
Read the Overview
- On the left, Account Info lists the robot, account type, strategy tags, broker, server, currency, initial balance and VM. Click Edit to change them.
- On the right, the figures sit in five columns: Account, Returns, Drawdown, Ratings and Activity. Point at the i beside a figure to see what it means.
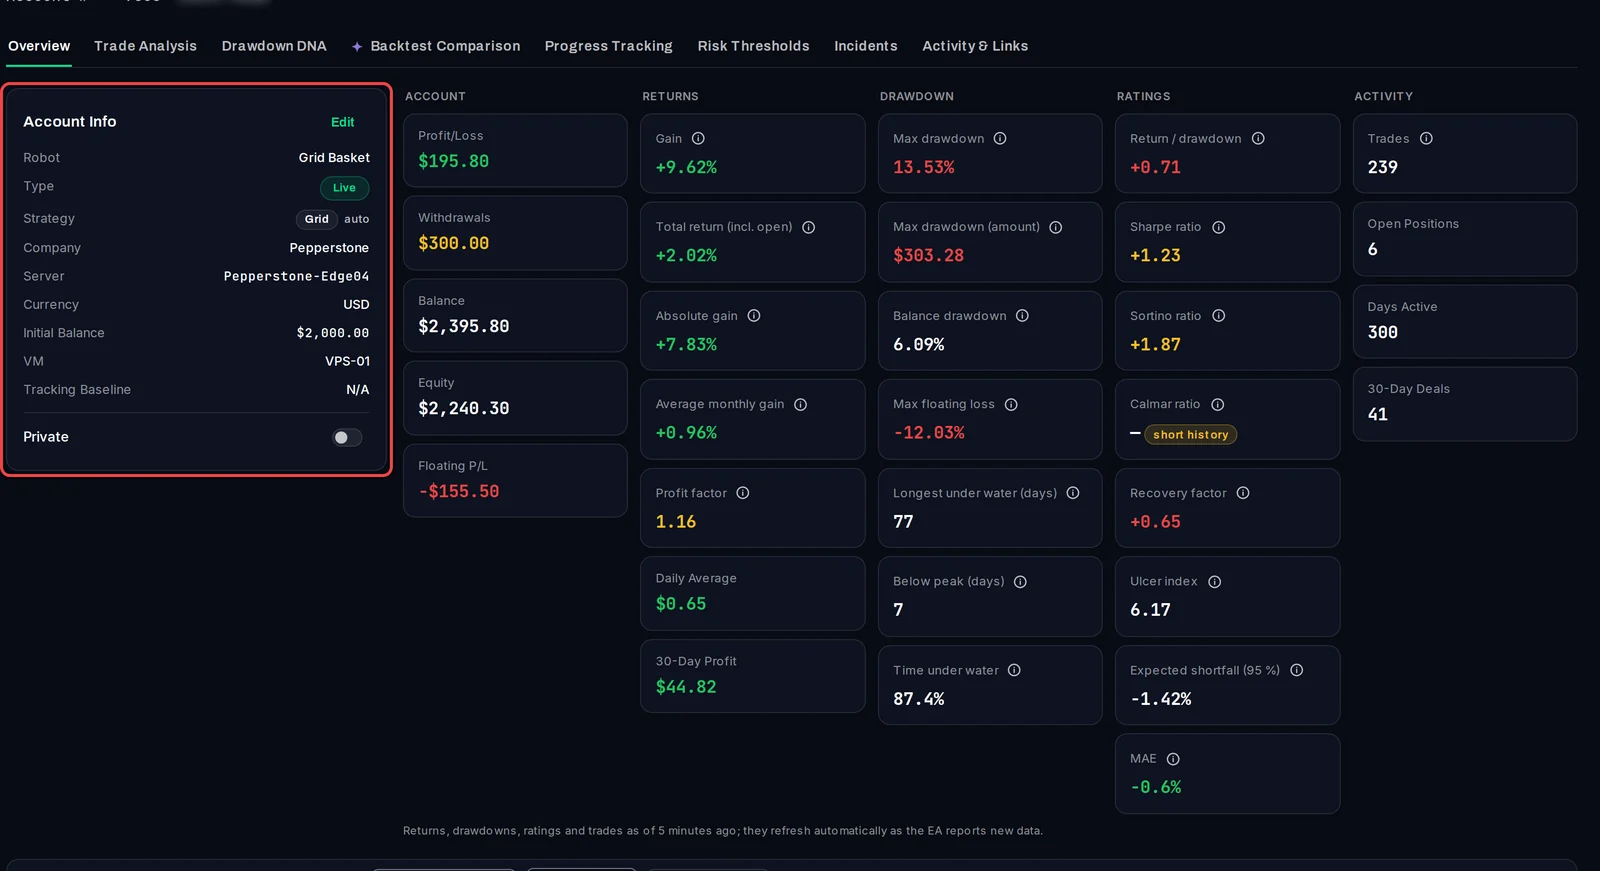
- Scroll down for the filter bar, the equity chart and the Performance Summary (today, this week, this month and this year, each compared with the period before).
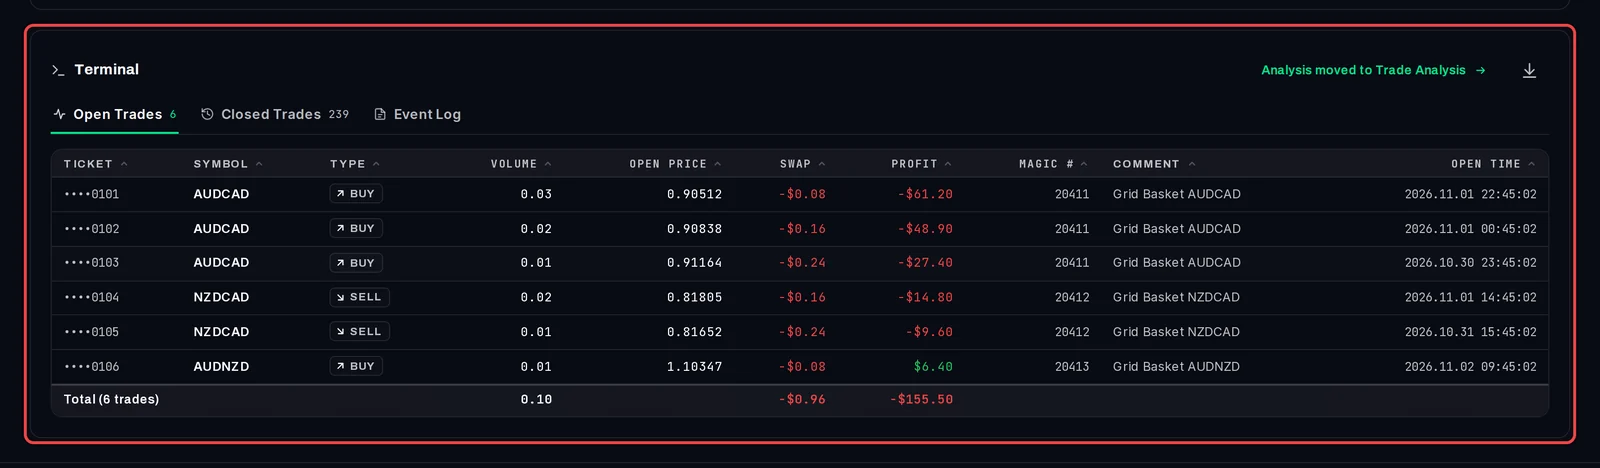
- At the bottom, the Terminal shows Open Trades, Closed Trades and the Event Log, the way MetaTrader does.
Good to know
- The figures in the five columns are for the whole account. The filter bar narrows the chart, the Performance Summary, the Terminal and Trade Analysis, not these figures.
- Drawdown counts open trades, as MetaTrader does, so you see the real dip while trades are still running.
- The figures refresh by themselves each time the EA reports, every 2 to 5 minutes. The note under the columns says how old they are.