
Knowledge Base
Help Center articles
Use the equity chart: views, ranges and CSV
The equity chart on the account page shows how the account grew: its balance, its equity with open trades counted, and every deposit and withdrawal. You can switch what it shows, zoom to a period and download the data.
Plan: every plan.
Choose a view and a range
- Open the account. The chart is on the Overview tab, under the filter bar.
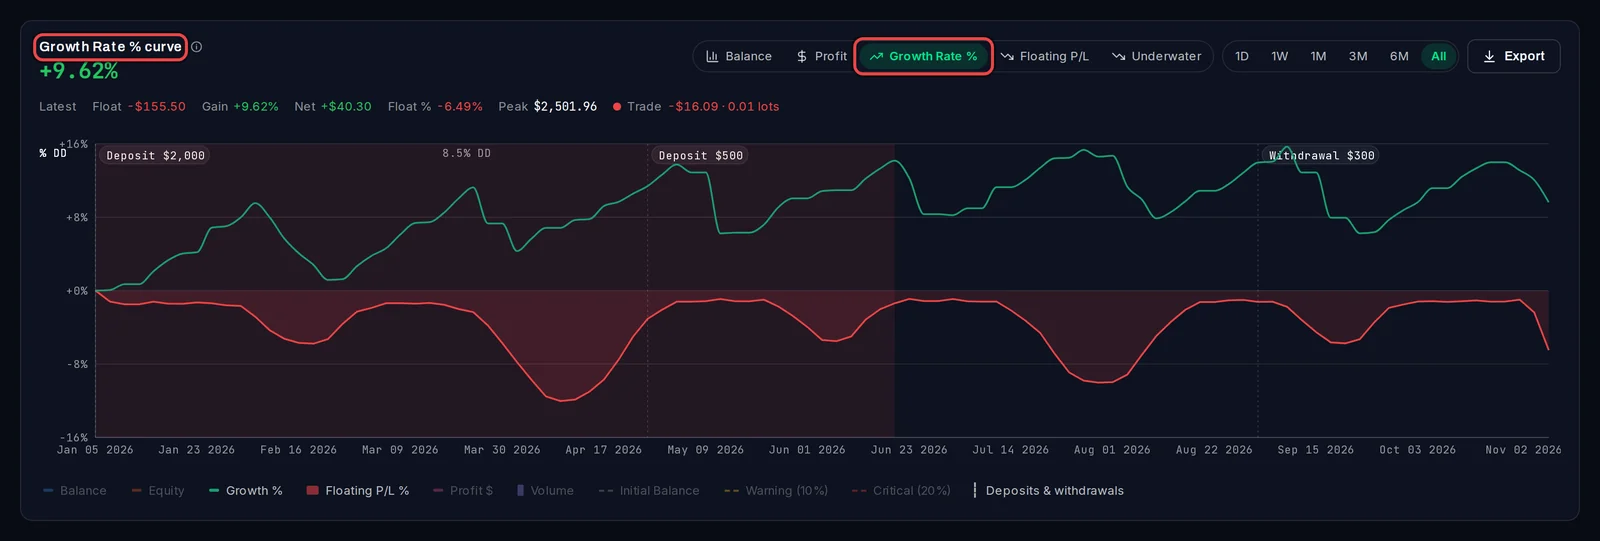
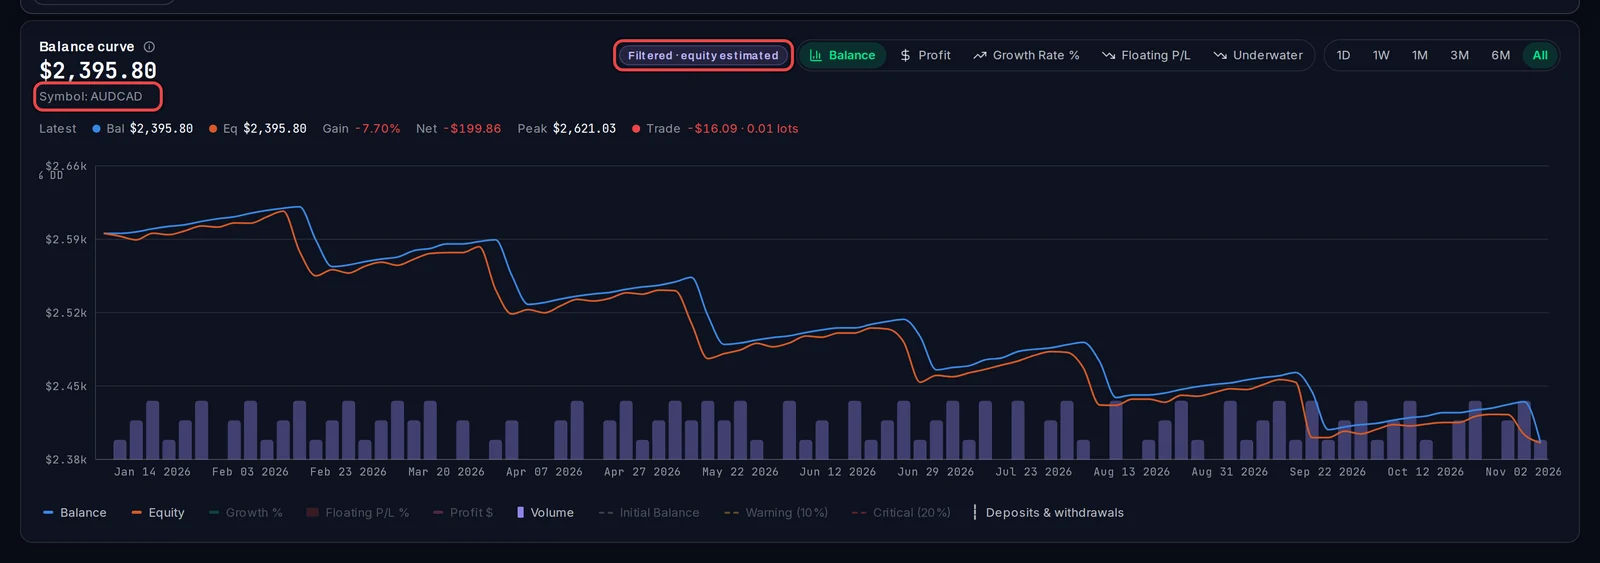
- Pick a view at the top right: Balance, Profit, Growth Rate %, Floating P/L (the loss or profit of open trades, as a share of the balance) or Underwater (how far below its last high the account is).
- Pick a range: 1D, 1W, 1M, 3M, 6M or All.
- Move the mouse over the chart. The line above it shows the balance, equity, gain and profit at that point.
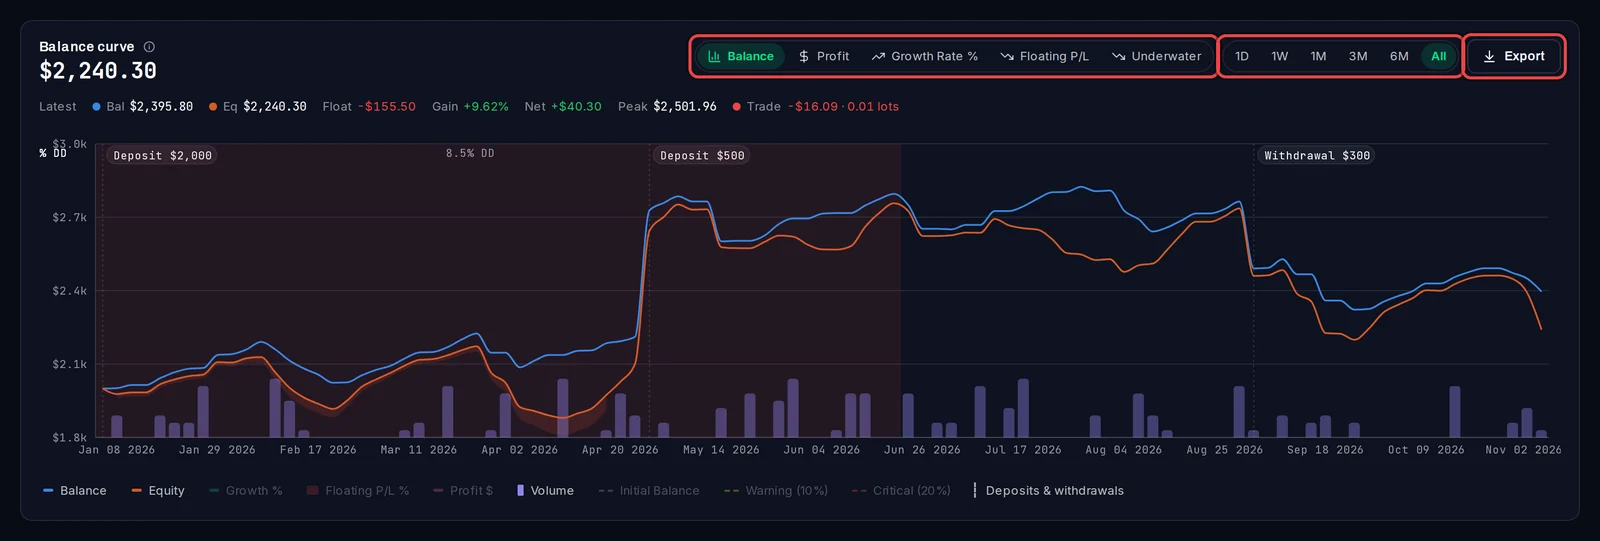
Click a name in the legend under the chart, such as Volume or Initial Balance, to show or hide that line.
Spot deposits and withdrawals
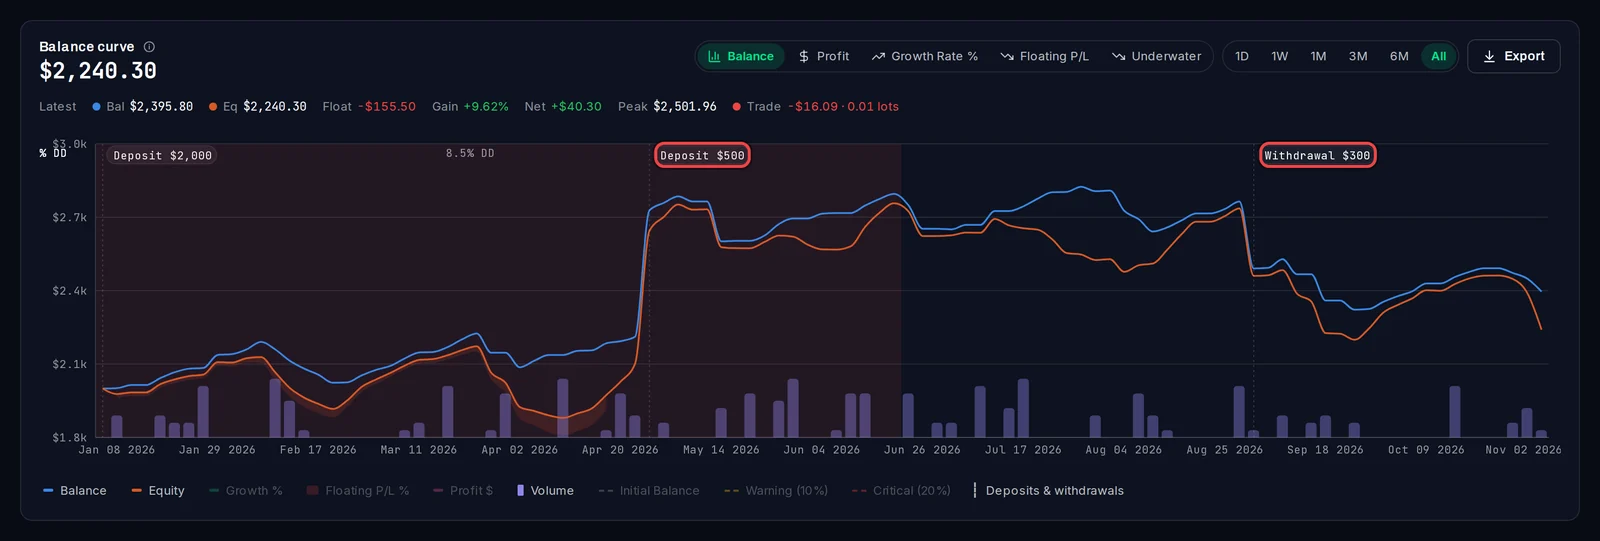
- Each deposit and withdrawal is a dotted line with a label, for example Deposit $500 or Withdrawal $300.
- The money you add or take out is not counted as profit or loss.
Read the reconstructed part
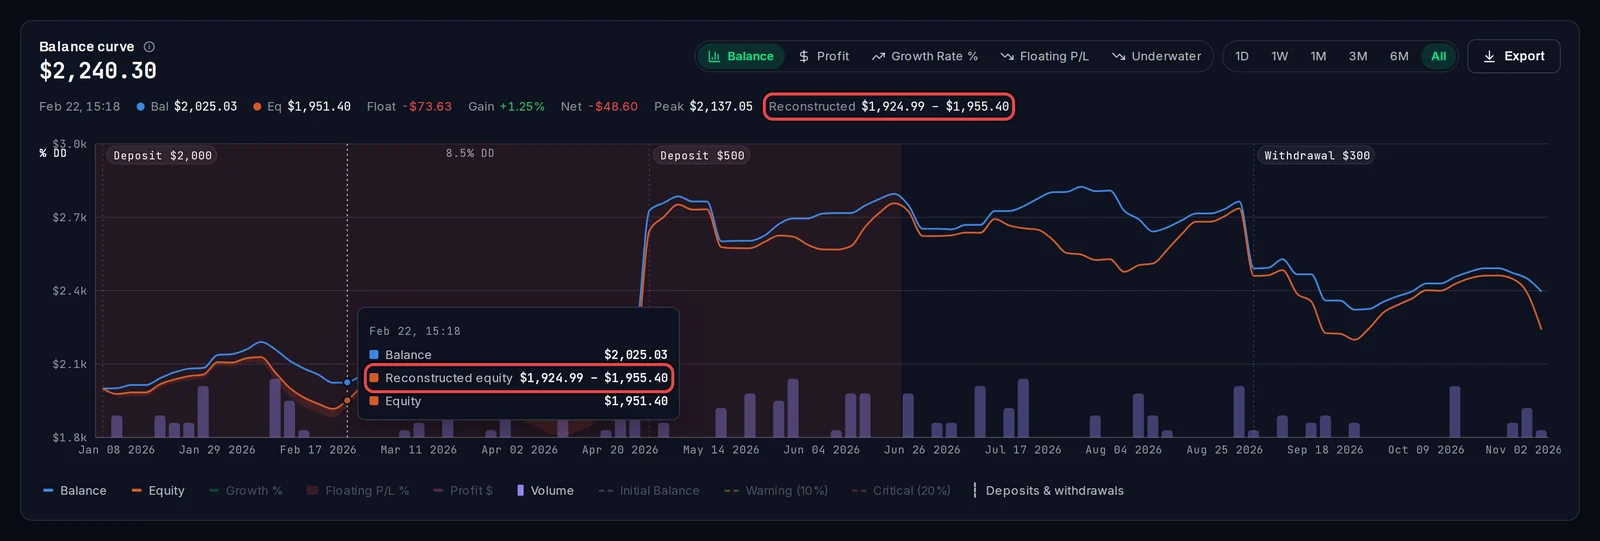
If the account traded before you attached the EA, the chart rebuilds that earlier history from the trades and price data. There, equity is shown as a band, a range rather than one exact value. Point at that part of the curve and the line above the chart shows Reconstructed with the range.
See one robot's curve
- Filter the page in the filter bar, for example to one symbol or magic number.
- The chart redraws only those trades and is marked Filtered · equity estimated, with the filter written under the headline figure.
Download the data
- Pick the range you want.
- Click Export. A CSV file with the balance and equity over time is saved to your computer.
Good to know
- A filtered curve is an estimate: it replays the selected trades on the balance they started from and counts each trade at its worst moment, so it leans deep. Deposits and withdrawals are left out.
- Export is hidden while the page is filtered, and the range buttons are greyed out while a period is set in the filter bar.
- Shaded areas labelled with a percentage, such as 8.5% DD, mark the account's drawdowns.
- In the Floating P/L view, dashed lines mark a 10 % warning and a 20 % critical level.