
Knowledge Base
Help Center articles
Max drawdown tells you how deep an account fell once. Drawdown DNA shows every fall: how deep, how long it took to hit bottom and how long it took to get back, so you know what a normal bad patch looks like for this robot. A drawdown is how far the account is below its highest point.
Plan: Pro or VIP. The 14 days of Pro every new user starts with include it.
Open Drawdown DNA
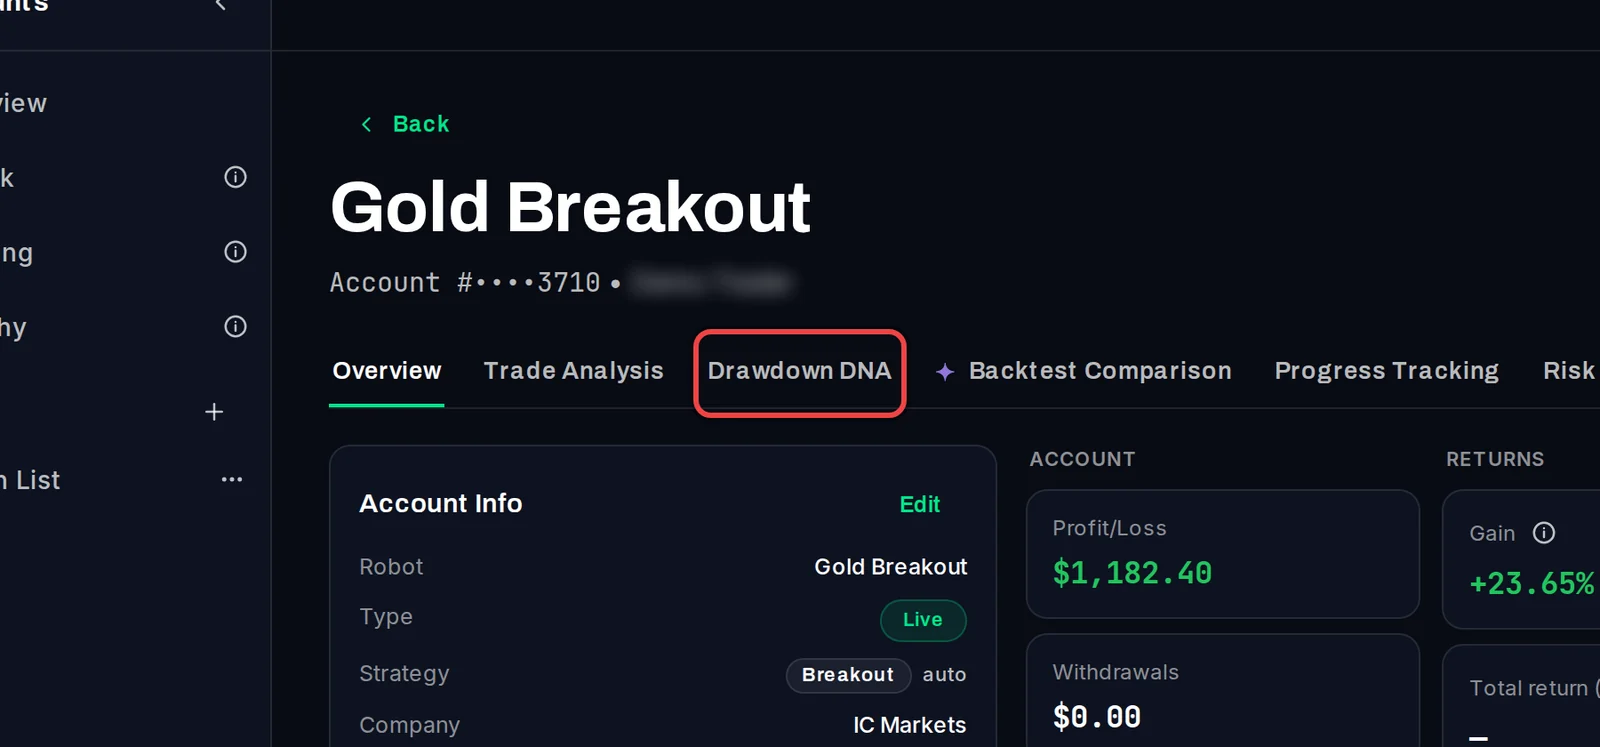
- On the Overview, click the account's name.
- Click the Drawdown DNA tab.
Read the figures
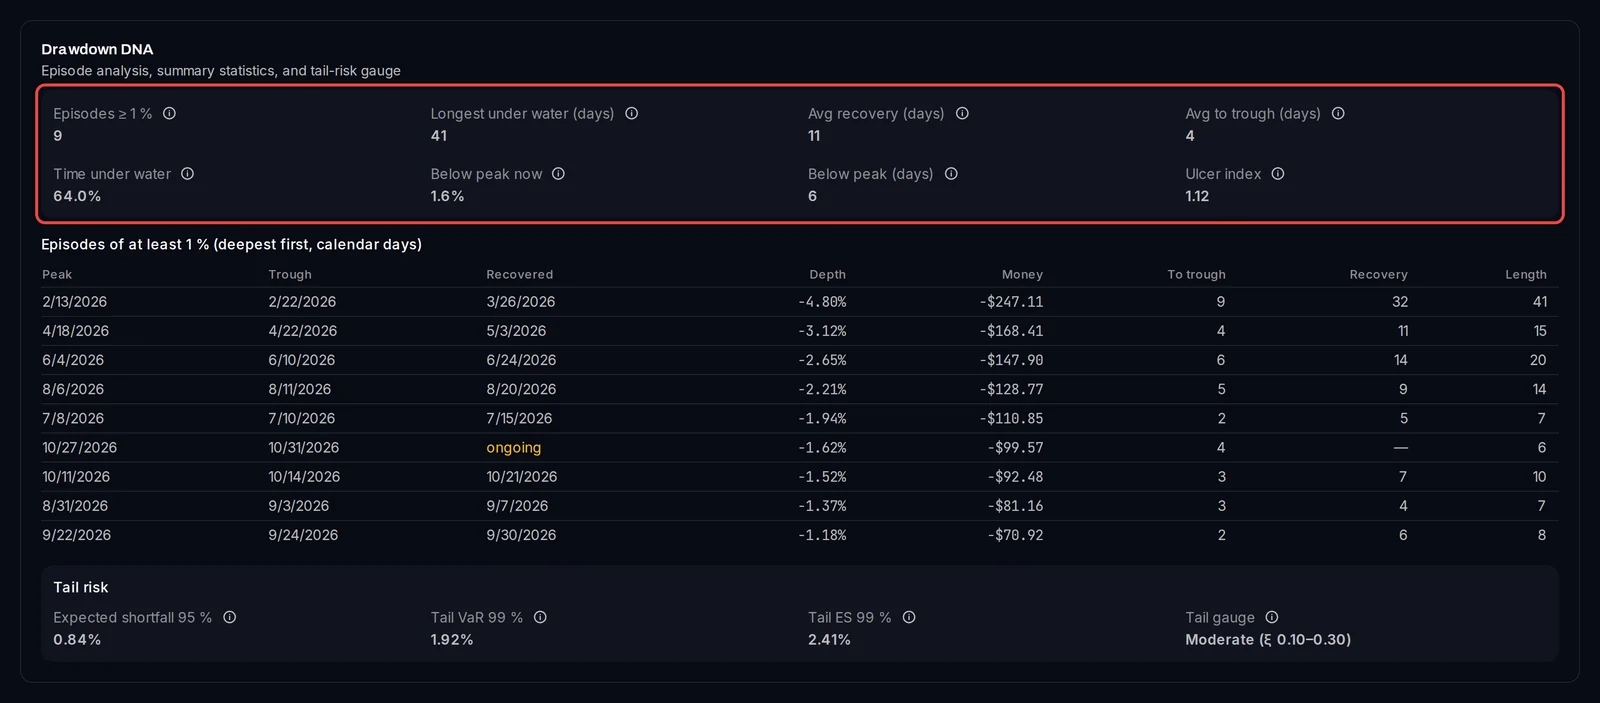
Every time the account fell at least 1 % below a peak and either came back or is still down counts as one episode. Hover the i beside a figure for a plain explanation and the ranges to read it by.
- Episodes ≥ 1 %: how many drawdowns of 1 % or more.
- Longest under water (days): the longest time from a peak until the account got back to it.
- Avg recovery (days) and Avg to trough (days): how long the climb back took, and how long the fall lasted.
- Time under water: the share of days spent below a peak.
- Below peak now and Below peak (days): the current dip and how long it has lasted.
- Ulcer index: one number for how deep and how long the drawdowns were together.
Below them, the episodes table lists each drawdown, deepest first: its Peak, Trough (the bottom) and Recovered dates, its Depth in % and money, and the days to the trough, to recover and in total. A drawdown still going on says ongoing.
Read the tail risk
Expected shortfall 95 % is the average loss on the account's worst 5 % of days. Tail VaR 99 % and Tail ES 99 % estimate a 1-in-100 bad day and the days worse than that. The Tail gauge says whether the worst days stay close to the usual bad ones (Thin) or are sometimes far worse (Heavy).
See it as a chart
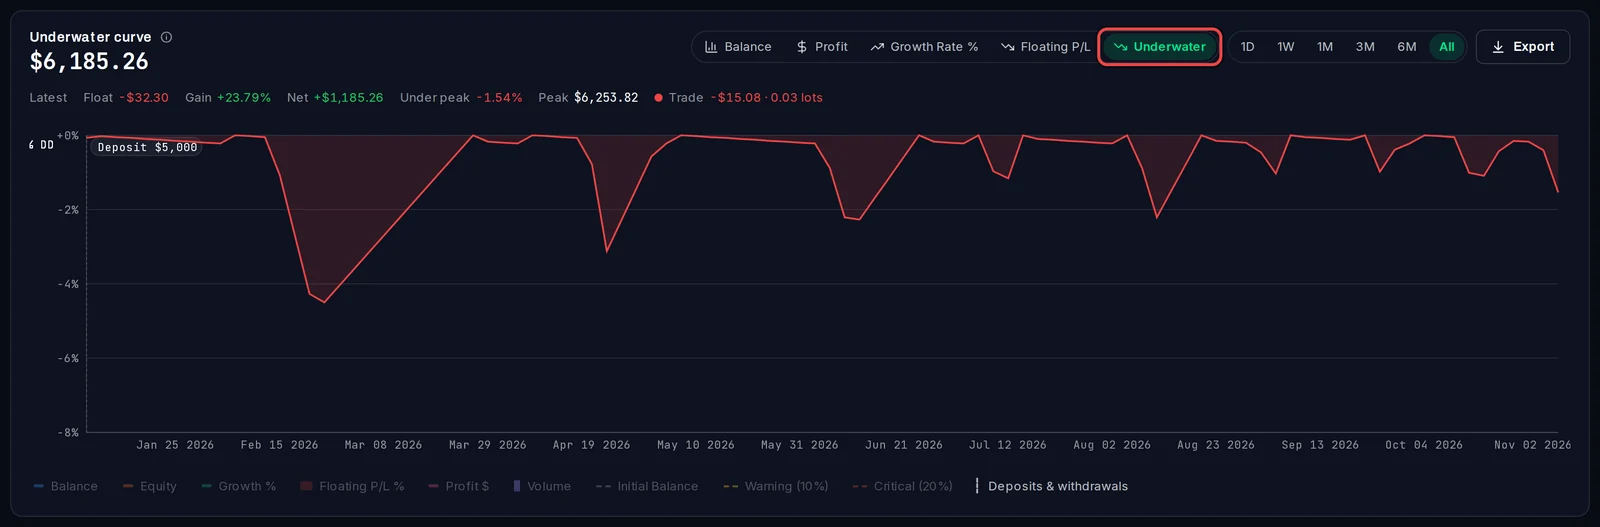
- Click the Overview tab.
- Above the chart, click Underwater. The red area shows how far below its last peak the account was on each day.
Good to know
- The tail figures need enough history: expected shortfall needs 100 days in the market. Until then they show as not available, or the gauge says Not enough loss days for a fit.
- The trade filter at the top of the tab narrows Drawdown DNA to one robot, symbol or date range.
- Two built-in alerts on the Alerts page use these figures: Long drawdown (90 days below the peak) and Time under water > 20%.
- The Underwater view of the chart works on every plan.