
Knowledge Base
Help Center articles
Each backtest has its own result page: its settings, its figures, the balance and equity chart and every trade. Open it to judge a test, run it again or reuse its setup.
Plan: every plan.
Open a result
- Click Results in the menu on the left.
- Click the backtest's name. The page opens on the Overview tab.

Read the Overview
Settings on the left lists what was tested: symbol, period, dates, deposit, Quality (how complete MT5's price history was), Model (the tick model, for example Every tick (real)), leverage and the broker it ran on.
The figures sit in five groups: Account, Returns, Drawdown, Ratings and Activity. Point at the i next to a figure for a short explanation. A dash means the test has too little data for that figure.
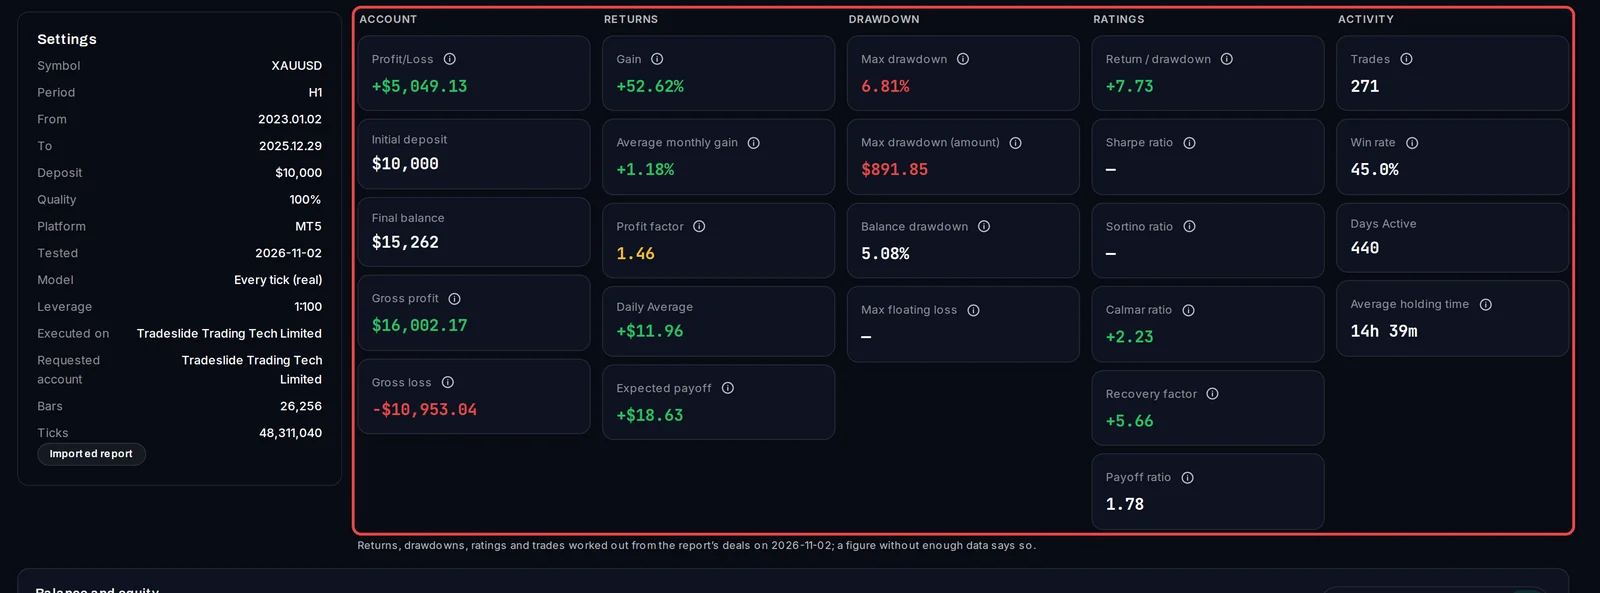
Further down are Balance and equity, Where the P/L falls (profit by hour, weekday or month), Monthly Performance, Drawdown & Risk (the figures as MT5's own report prints them), Trade Statistics and Spread stress.
Read the balance and equity chart
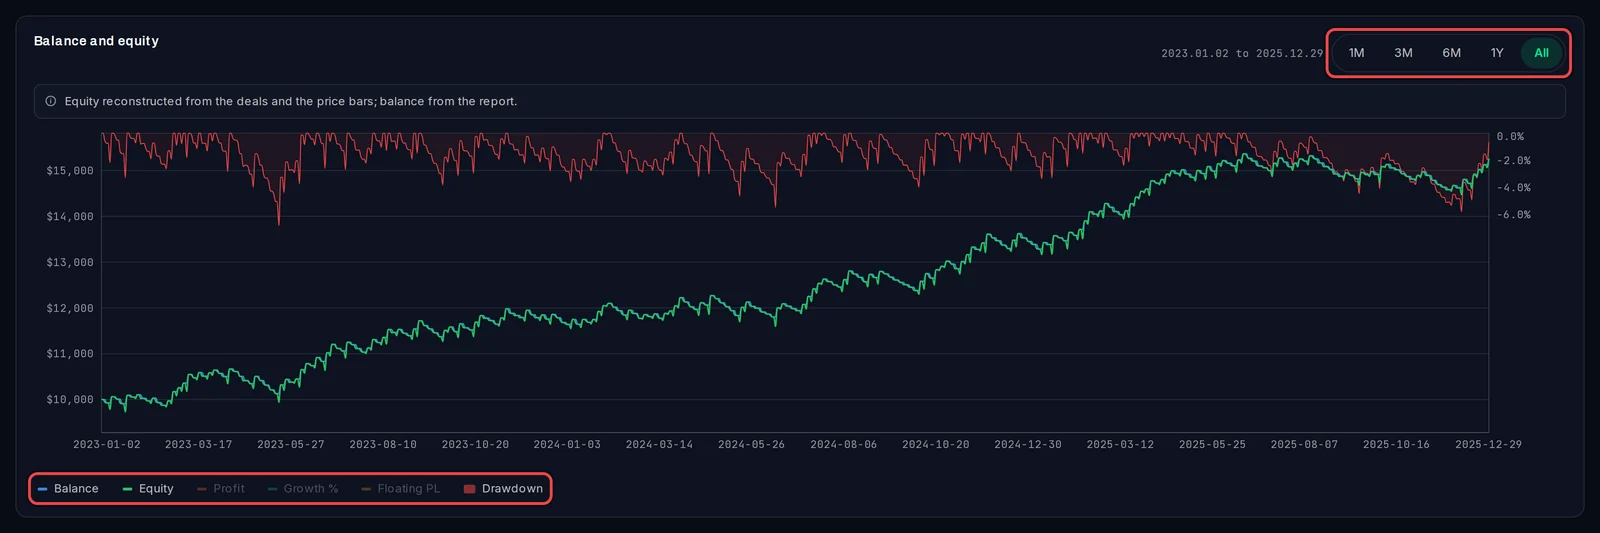
- Balance moves when a trade closes. Equity also counts trades that are still open, so it shows the dips in between. Drawdown (the shaded area, right-hand scale) is how far equity sits below its last peak.
- Click 1M, 3M, 6M, 1Y or All to change the time range.
- Click a name under the chart to show or hide that line, for example Floating PL (the open trades' profit or loss).
Use the other tabs
- Compare: this test's curve and figures beside other backtests.
- Deals: every deal, as in the MT5 report. Trade History: each trade from open to close.
- Trade Analysis: profit by symbol, hour and weekday, how far trades went against you, and long against short trades.
- Risk: annual return, the worst days, how smooth the curve is and how long profit targets took to reach.
- Sensitivity: how the result changes with the EA's input values.
Run it again or reuse the setup
- Re-test opens the New test page filled in with this test's settings.
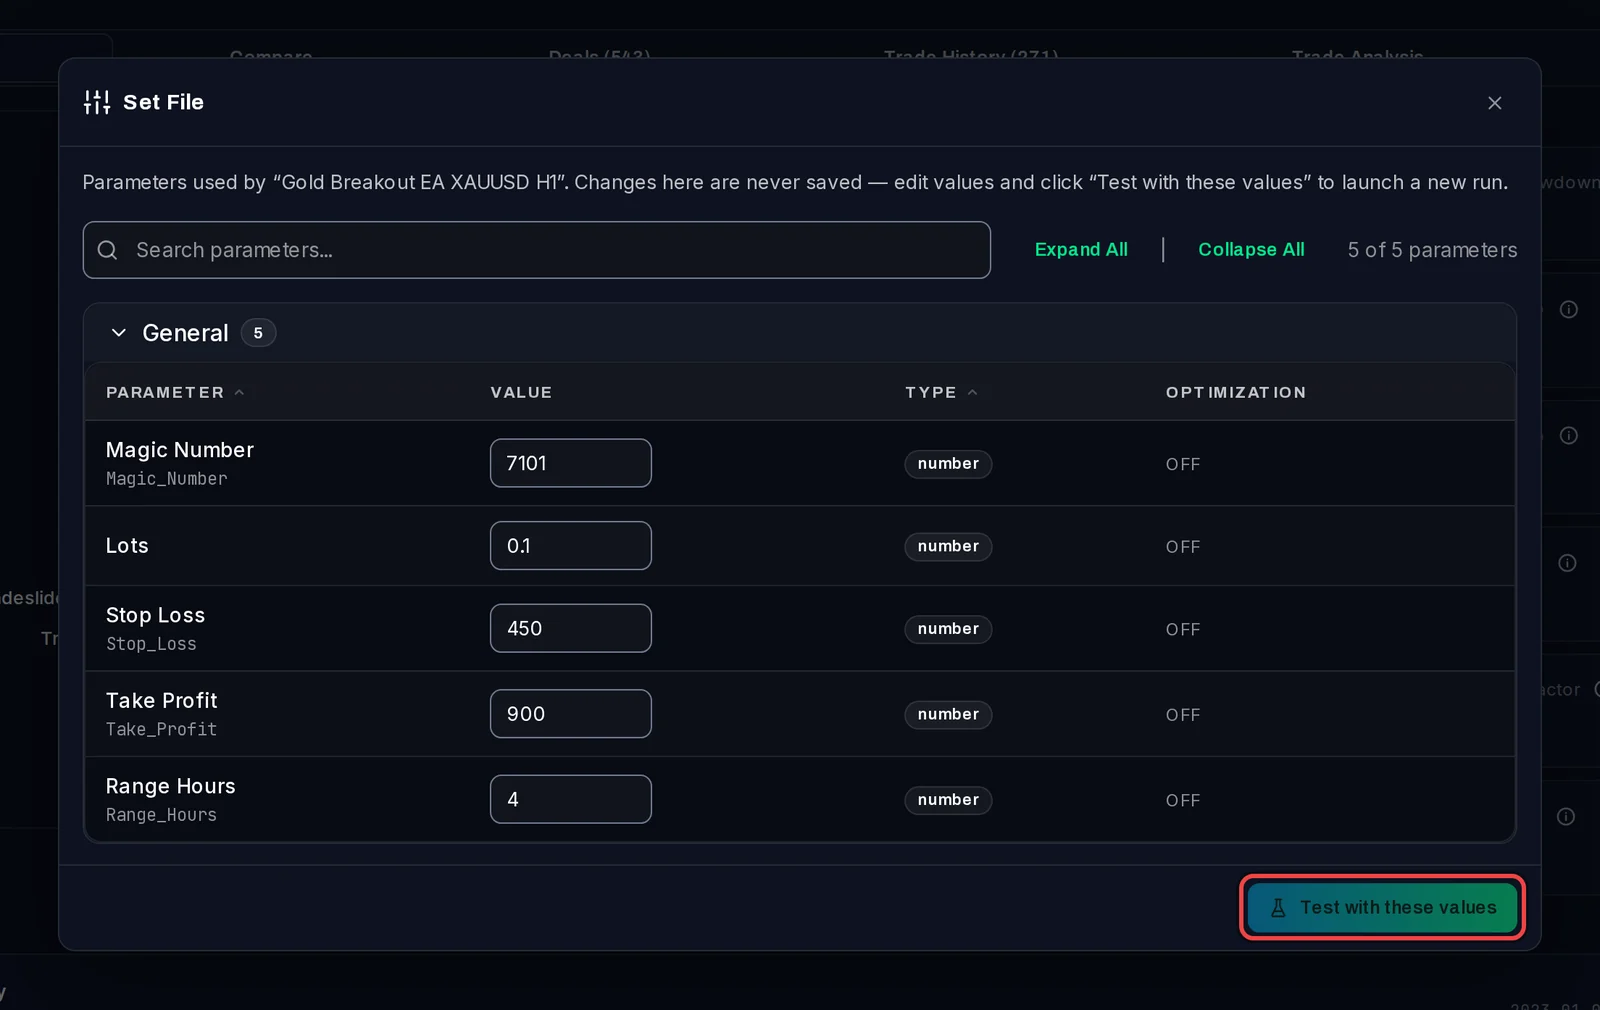
- View Set File shows the input values the test ran with. Change a value and click Test with these values to queue a new test straight away; your set file itself is not changed.
- Save as template keeps the setup, without dates or results, under Library › Templates.
Good to know
- The pencil next to the test's name renames it.
- The equity line is rebuilt from your test terminals' price history. When part of it is missing, the page says Equity chart is approximate or shows the balance only.
- Spread stress estimates the net profit with a wider spread (+1 to +5 pips). It is a model, not a measurement, and does not apply to symbols that are not currency pairs, such as gold.