
Knowledge Base
Help Center articles
See how sensitive a result is (Sensitivity tab)
A good result is worth more when nearby input values do well too. The Sensitivity tab lays your runs of one EA out on a grid of two inputs, for example stop loss against take profit, so you can see whether a result sits in a broad good area or is a lucky single setting.
Plan: every plan.
Have several runs to compare
The tab uses this result and your other results of the same EA, symbol, timeframe and test dates whose input values differ. Make them with a batch of tests using several set files, or by promoting several passes of an optimization to backtests. With a single run, the grid has one cell.
Open the Sensitivity tab
- Open one of the results: Results, then click the backtest's name. (Or use the row's ⋯ menu › Sensitivity.)
- Click the Sensitivity tab.
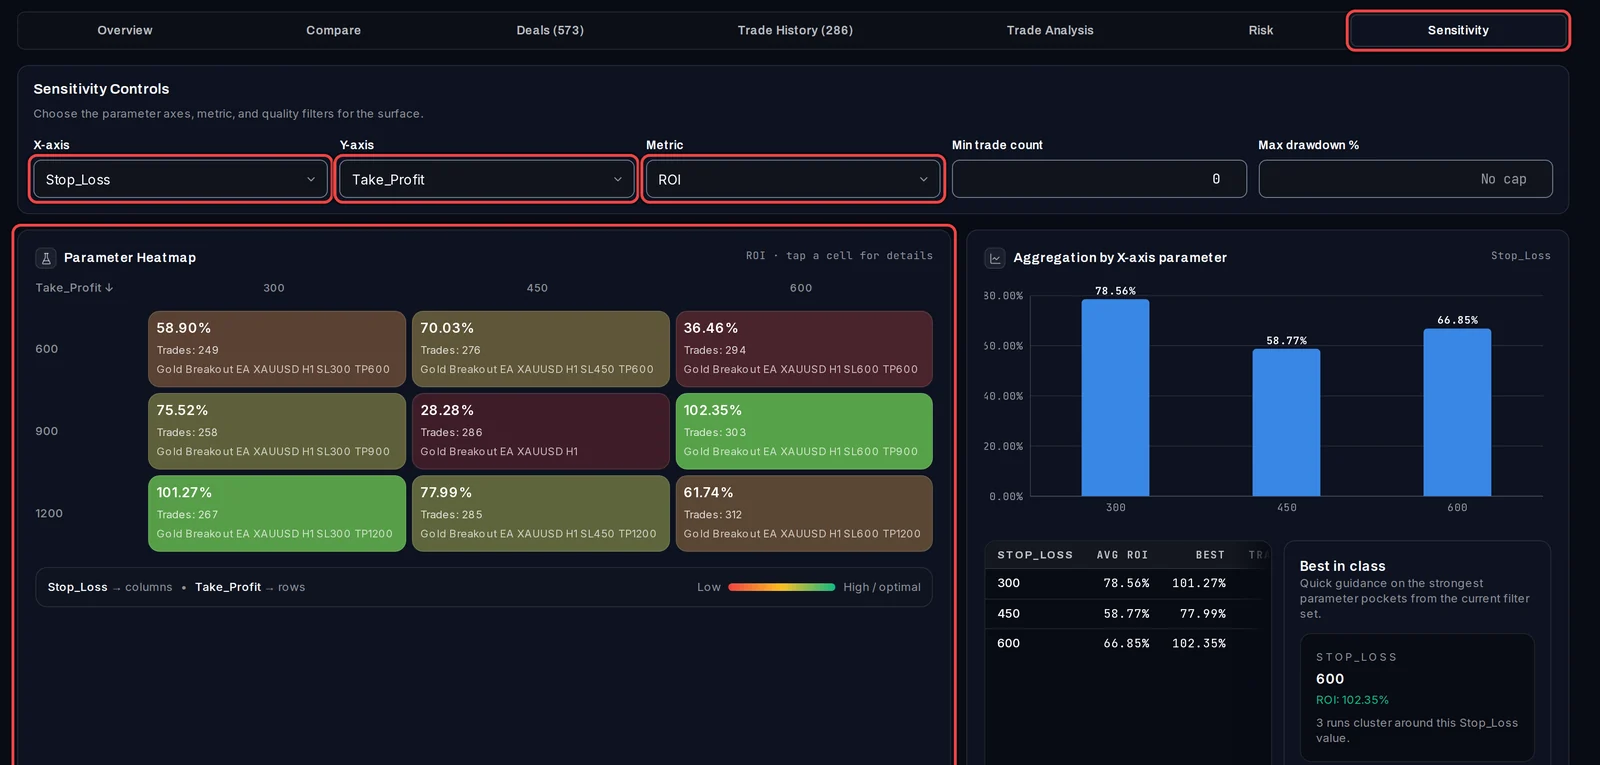
- Under Sensitivity Controls, pick the two inputs in X-axis (across) and Y-axis (down).
- Pick the Metric that colours the cells: ROI (return), Max DD, Sharpe, Profit Factor or Performance Score.
- Optional: set Min trade count or Max drawdown % to leave out runs with too few trades or too deep a drawdown.
Read the heatmap
- Each cell of the Parameter Heatmap is one combination of the two inputs, with its metric, its number of trades and the test's name. Green is better, red is worse.
- A cell with a dash and Trades: 0 is a combination you have not tested yet.
- A robust EA shows a patch of similar, good cells. One good cell surrounded by poor ones is a warning sign that the result may not hold up.
- Aggregation by X-axis parameter and Aggregation by Y-axis parameter show the average and best result for each value of one input. Best in class names the strongest values.
Look at one cell
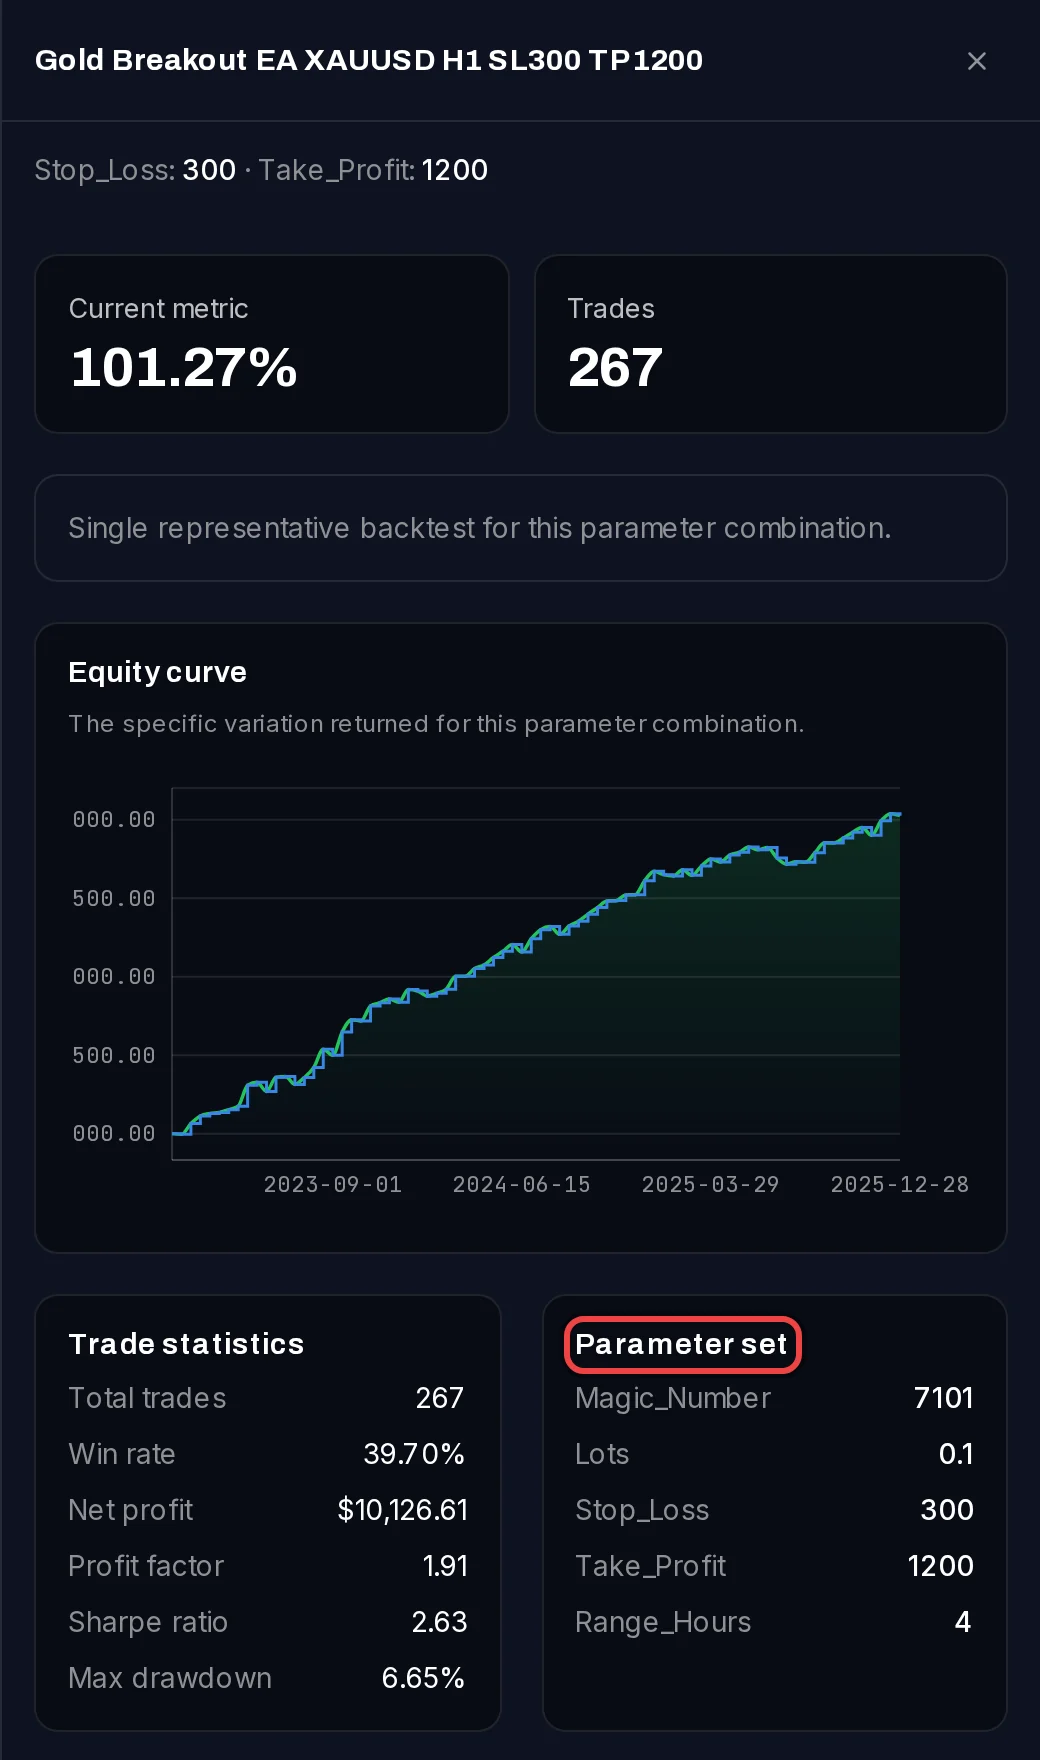
- Click a cell. A panel opens with the run's figures, its equity curve, its Trade statistics and its Parameter set, the full list of input values.
- Click Close to go back to the grid.
Good to know
- Combined backtests have no Sensitivity tab.
- If the report has no input values, the tab says No parameter data found.
- To test a missing combination, open a result's View Set File, change the values and click Test with these values.