
Knowledge Base
Help Center articles
Compare backtests
Put backtests side by side to see which one holds up better: the same EA on two brokers, with two set files, or two different EAs. Their equity curves share one chart and their main figures sit in one table.
Plan: every plan.
Pick the backtests to compare
- Open the first result: Results, then click the backtest's name. It becomes the Baseline.
- Click the Compare tab. (From the Results list, the row's ⋯ menu › Compare opens the same tab.)
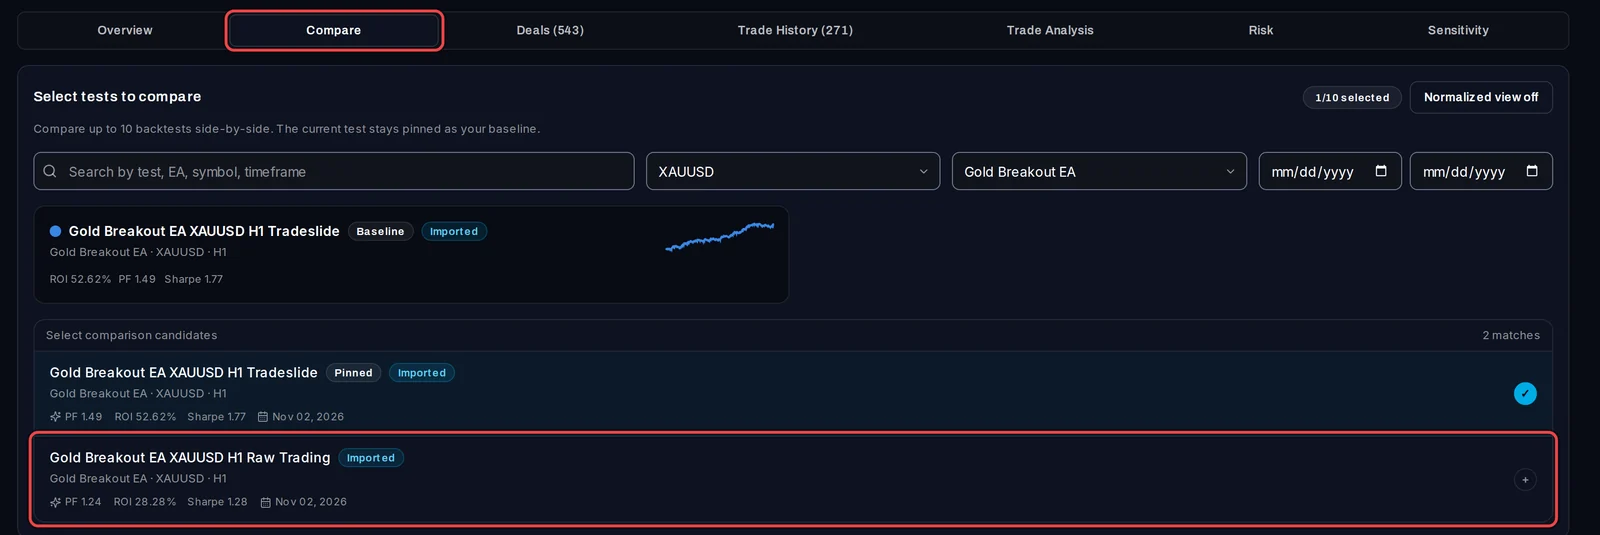
- Under Select comparison candidates, the list shows your other results with the same symbol and EA. To see others, change the symbol or EA filter to All symbols or All EAs, or type in the search box.
- Click each result you want to add. You can compare up to 10; the count shows as, for example, 2/10 selected.
Read the comparison
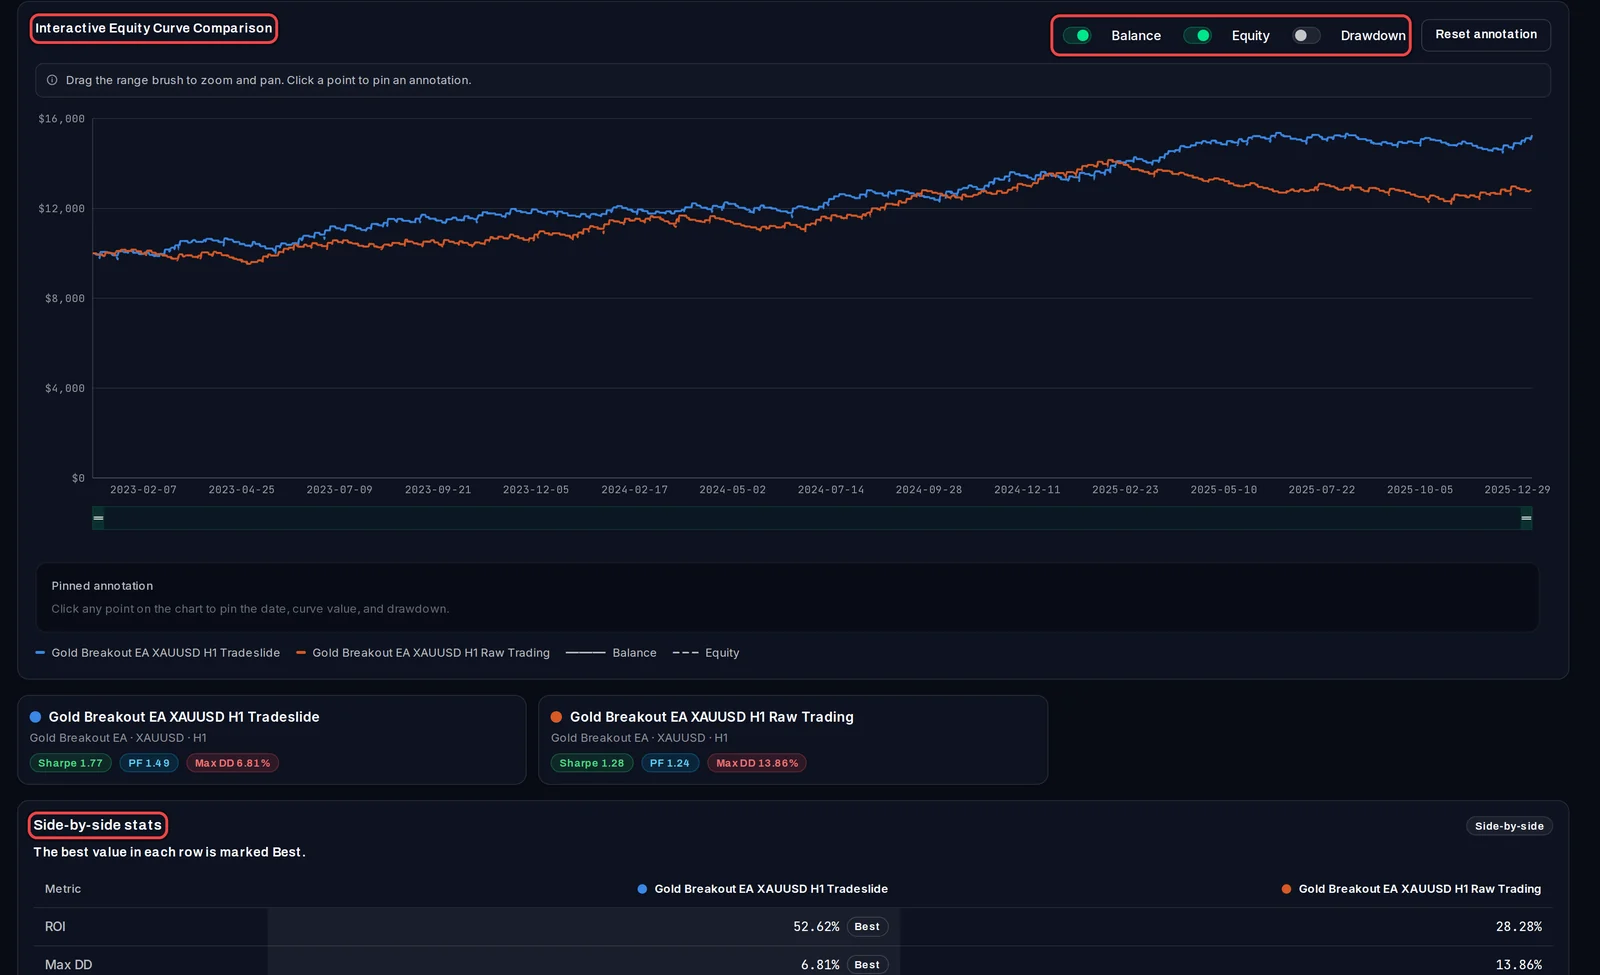
- Interactive Equity Curve Comparison draws each test in its own colour. Use the Balance, Equity and Drawdown switches to choose the lines.
- Drag the ends of the bar under the chart to zoom in on a period. Click a point on a curve to pin its date, value and drawdown; Reset annotation removes it.
- In Side-by-side stats, compare ROI (return on the deposit), Max DD, Sharpe, Profit Factor and Total Trades. The better value in each row is marked Best.
Good to know
- Tests with different deposits are hard to compare in dollars. Click Normalized view off to switch it on: every curve then starts at 100, so you compare growth, not amounts.
- Give each result a clear name first (the pencil next to its name on the result page), for example the broker's name, so you can tell the curves apart.
- Comparing does not change or merge anything. To replay several results as one account, use Combine (Pro).