
Knowledge Base
Help Center articles
Read the portfolio overview and analysis
Once a portfolio is live, two pages report on it. Overview gives the headline figures, the strategies and their lot sizes, and warnings. Analysis stress-tests it: what if one strategy went, reshuffled histories, monthly returns and how the strategies move together.
Plan: every plan. Reading these pages does not use a Portfolio Builder run.
Read the Overview
- Click Portfolio in the left rail, then Overview. The line under the title says which portfolio is live, for example Deployed from Variants · Smooth-Equity.
- Under SUMMARY, read the tiles: Monthly Return (average monthly gain), Max Drawdown (the worst fall from a peak, against your limit), Sharpe Ratio (return per unit of ups and downs), Profitable Months, Return/DD (total return divided by max drawdown: higher is better) and more.
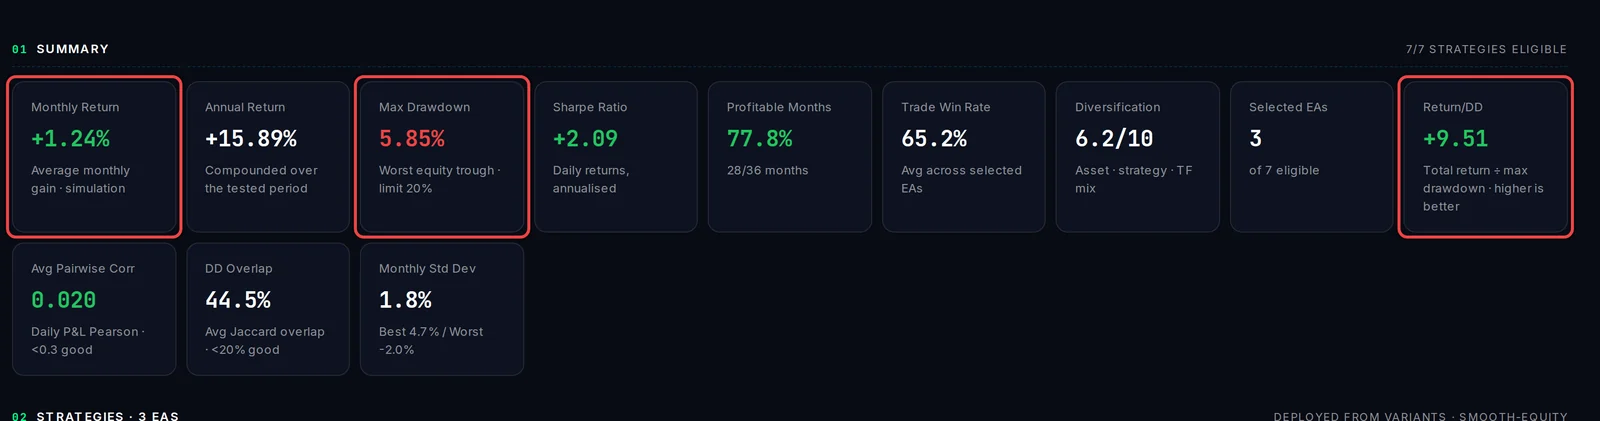
Below the tiles:
- STRATEGIES lists each strategy with its Lot multiplier (the lot size to trade it at, against its backtest) and why it is in.
- Warnings flags concentration, for example when every strategy trades USD or uses the same timeframe.
- The equity curve and the underwater chart show the combined account over the whole history.
Go further on Analysis
- Click Analysis in the menu beside the rail.
- Use the buttons at the top to jump to a section.
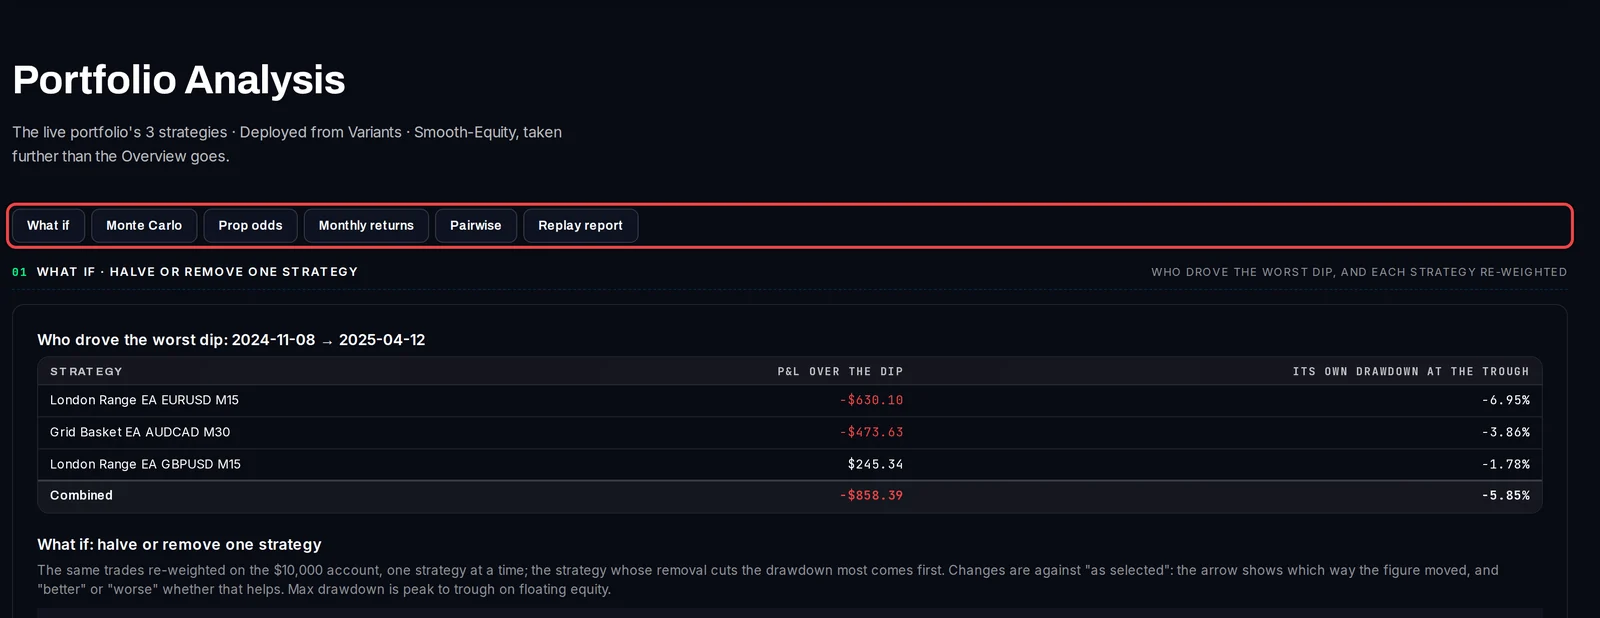
- What if: which strategies caused the worst dip, and how the portfolio changes if you halve or remove one of them.
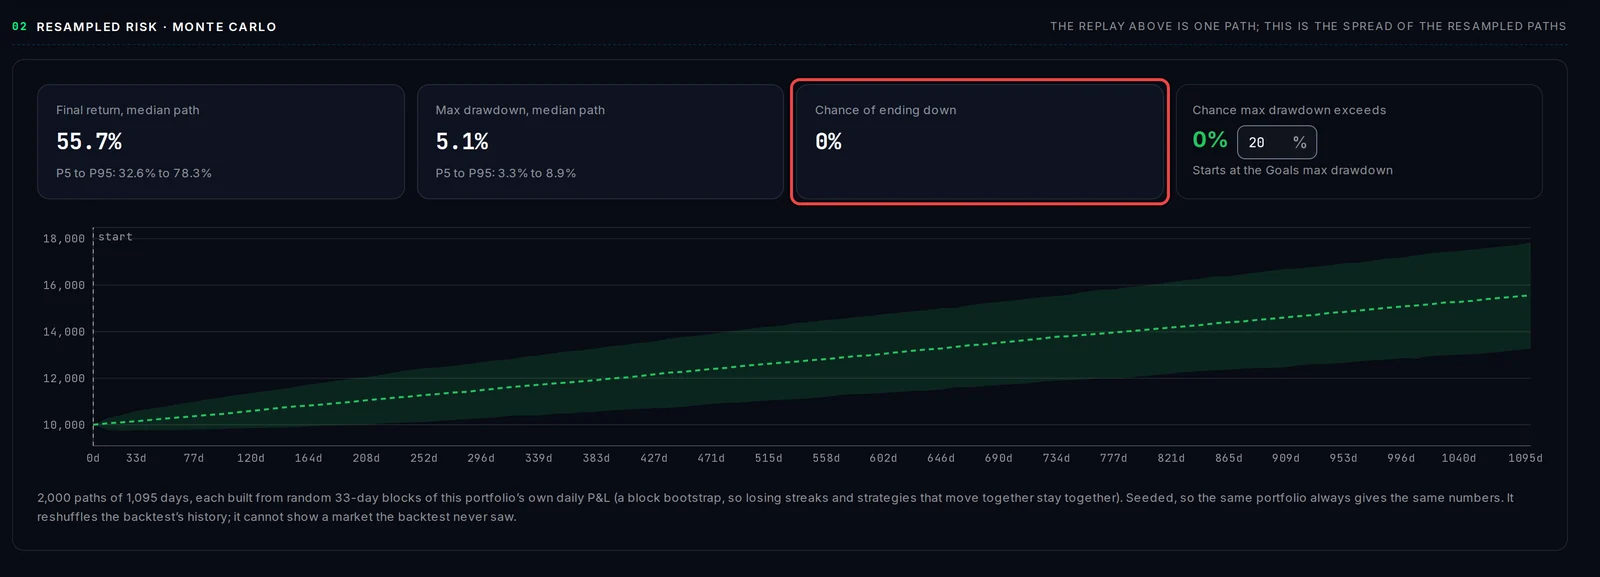
- Monte Carlo: 2,000 possible paths built by reshuffling blocks of the portfolio's own daily results. Read the median path's return and drawdown, the Chance of ending down, and the chance the drawdown goes past a limit you type in.
- Prop odds: the chance the portfolio passes a prop firm's challenge, with a Payout calculator.
- Monthly returns: one row per year, one cell per month.
- Pairwise: how often two strategies are in drawdown together, and how closely their daily results move.
- Replay report: replays the strategies together, bar by bar, and grades the mix. Click Run replay.
Good to know
- All figures come from the backtests. Monte Carlo reshuffles that history; it cannot show a market the backtests never saw.
- Nothing here places a trade. To trade a portfolio, run its EAs in your own MetaTrader at the lot multipliers shown.
- Nothing live yet? The pages say so. Build portfolios on Goals and deploy one on Variants or Combination Search.