
Knowledge Base
Help Center articles
Compare the portfolio variants
Each run on Goals builds six portfolios from your strategy pool, each chosen a different way. Variants puts them side by side so you can pick the one that suits you and make it your live portfolio.
Plan: every plan. Comparing and deploying variants does not use a Portfolio Builder run.
Compare the six cards
- Click Portfolio in the left rail, then Variants. The app also opens it when a run on Goals finishes.
- Read the cards. Each shows the portfolio's average Monthly return, its Max DD (the largest fall from a peak), its RDD (return divided by max drawdown: higher is better) and how many EAs it holds.
- Click a card to select it. The charts and tables below switch to that portfolio.
What each portfolio aims for:
- AI Portfolio (Pro): picked by the AI within your goals. Without AI it is the Fallback Portfolio, built with the standard rules.
- Lowest-DD: the lowest combined drawdown; stops adding strategies at 15% drawdown.
- Diversified: return for the drawdown, with a penalty for strategies that lose at the same time; stops at 20%.
- Balanced: balances return for the drawdown with total return; stops at 25%.
- Smooth-Equity: the steadiest returns (highest Sharpe ratio, return per unit of ups and downs); stops at 20%.
- Aggressive: the highest total return; stops at 50%.
Deploy one
- Select the card you want.
- Click Deploy … Portfolio under the cards, for example Deploy Smooth-Equity Portfolio. The button turns to Deployed to Overview and the card shows LIVE.
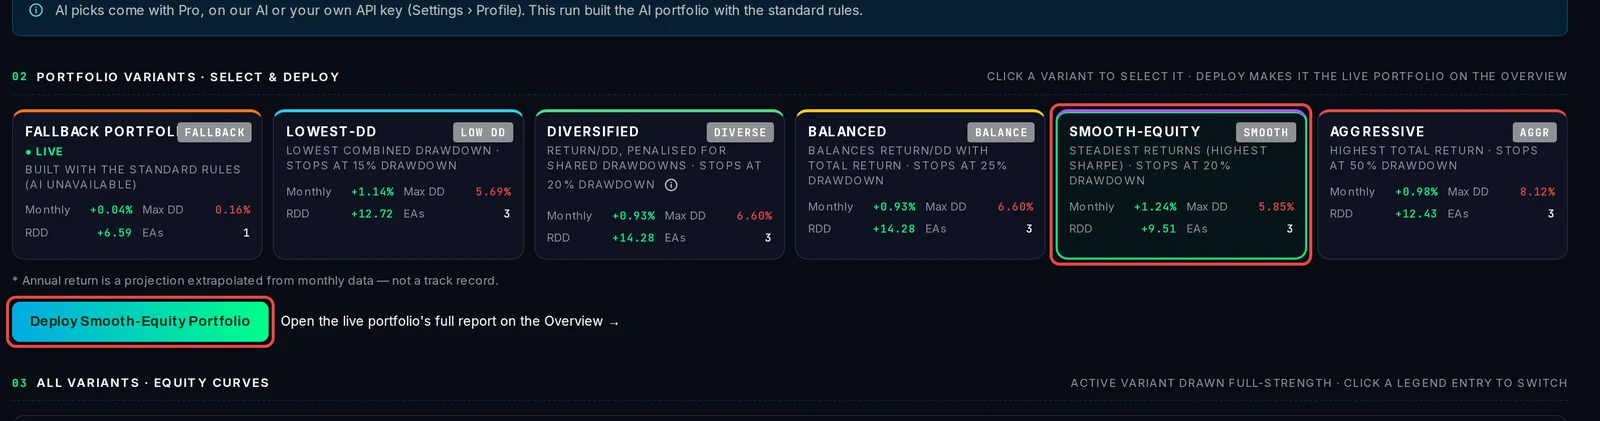
The live portfolio is the one the Overview and Analysis pages report on. Deploying only changes which portfolio they show; nothing is traded.
Check how each one holds up
Further down, COMPARE · HOW EACH VARIANT HOLDS UP lists all six in one table. Besides the figures on the cards it shows, for each portfolio:
- MC median and MC worst 5% DD: the median final return, and the max drawdown in the worst 5% of Monte Carlo paths (the portfolio's own history reshuffled into thousands of possible paths).
- Breach odds: the share of those paths that go past your max drawdown.
- Held out: how much of its return the portfolio kept on the held-out data, when you ran with Validate on holdout (70% or more held up; under 30% did not).
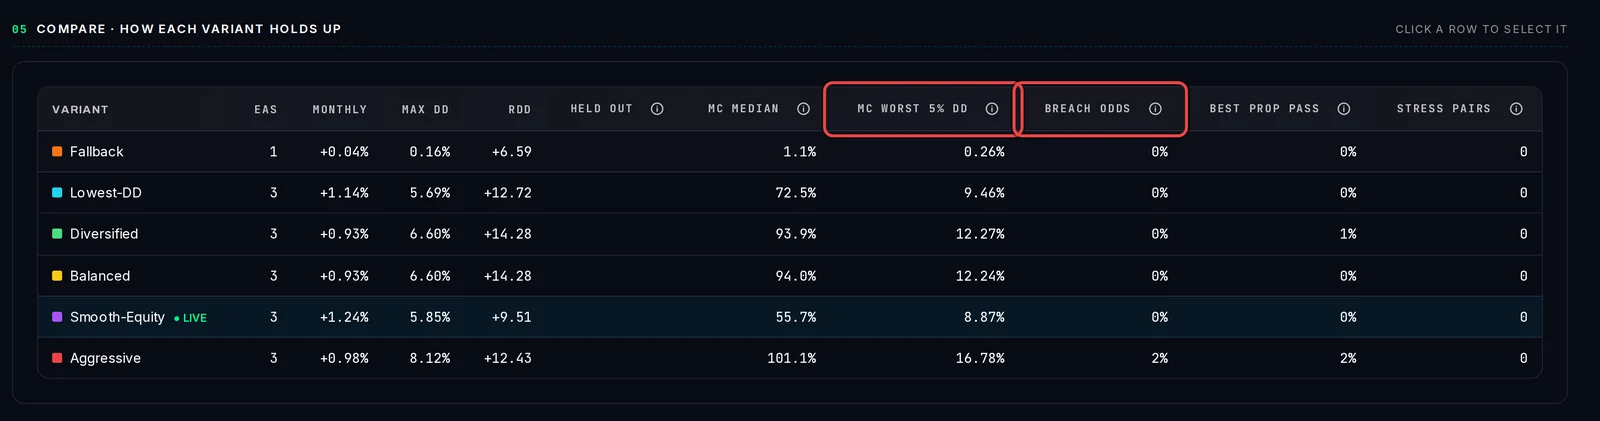
Click a row to select that portfolio. Hover the i next to a column for its full meaning.
Good to know
- After each run, the first portfolio (AI or Fallback) goes live by itself. Deploy another one if you prefer it.
- A card that says No portfolio met your limits found no mix inside your goals. Loosen them on Goals and run again.
- The variants stay until your next run, so you can come back and deploy a different one without running again.