
Knowledge Base
Help Center articles
Monthly breakdown for several accounts
The Monthly Breakdown adds up the months of as many accounts as you like, one row per month: profit and loss, costs, deposits, withdrawals and ending equity. Use it for your own review or download it as a spreadsheet.
Plan: every plan.
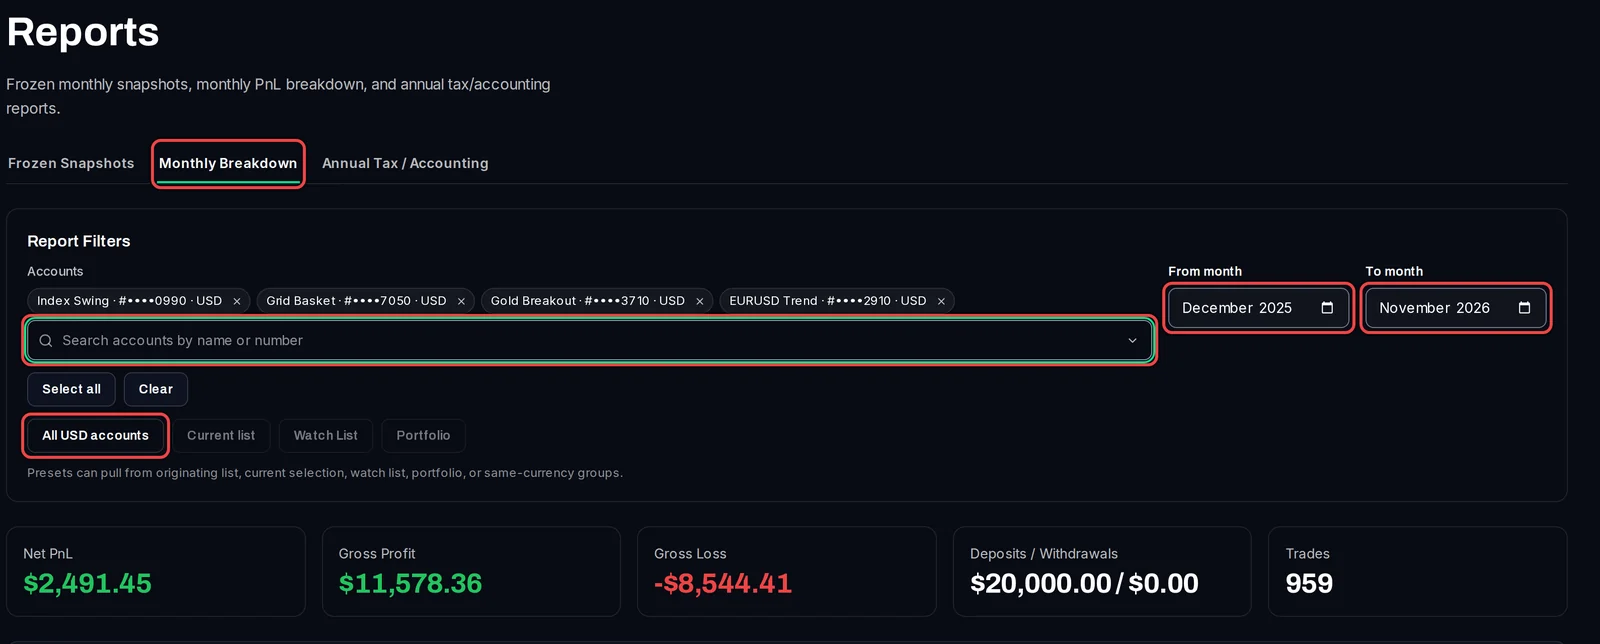
Choose the accounts and months
- In the menu on the left, click Analytics, then Reports.
- Click the Monthly Breakdown tab.
- Pick the accounts under Accounts, or click a shortcut such as All USD accounts or Watch List. Click the × on an account to take it out.
- Set From month and To month. It shows the last 12 months to start with.
Read and download it
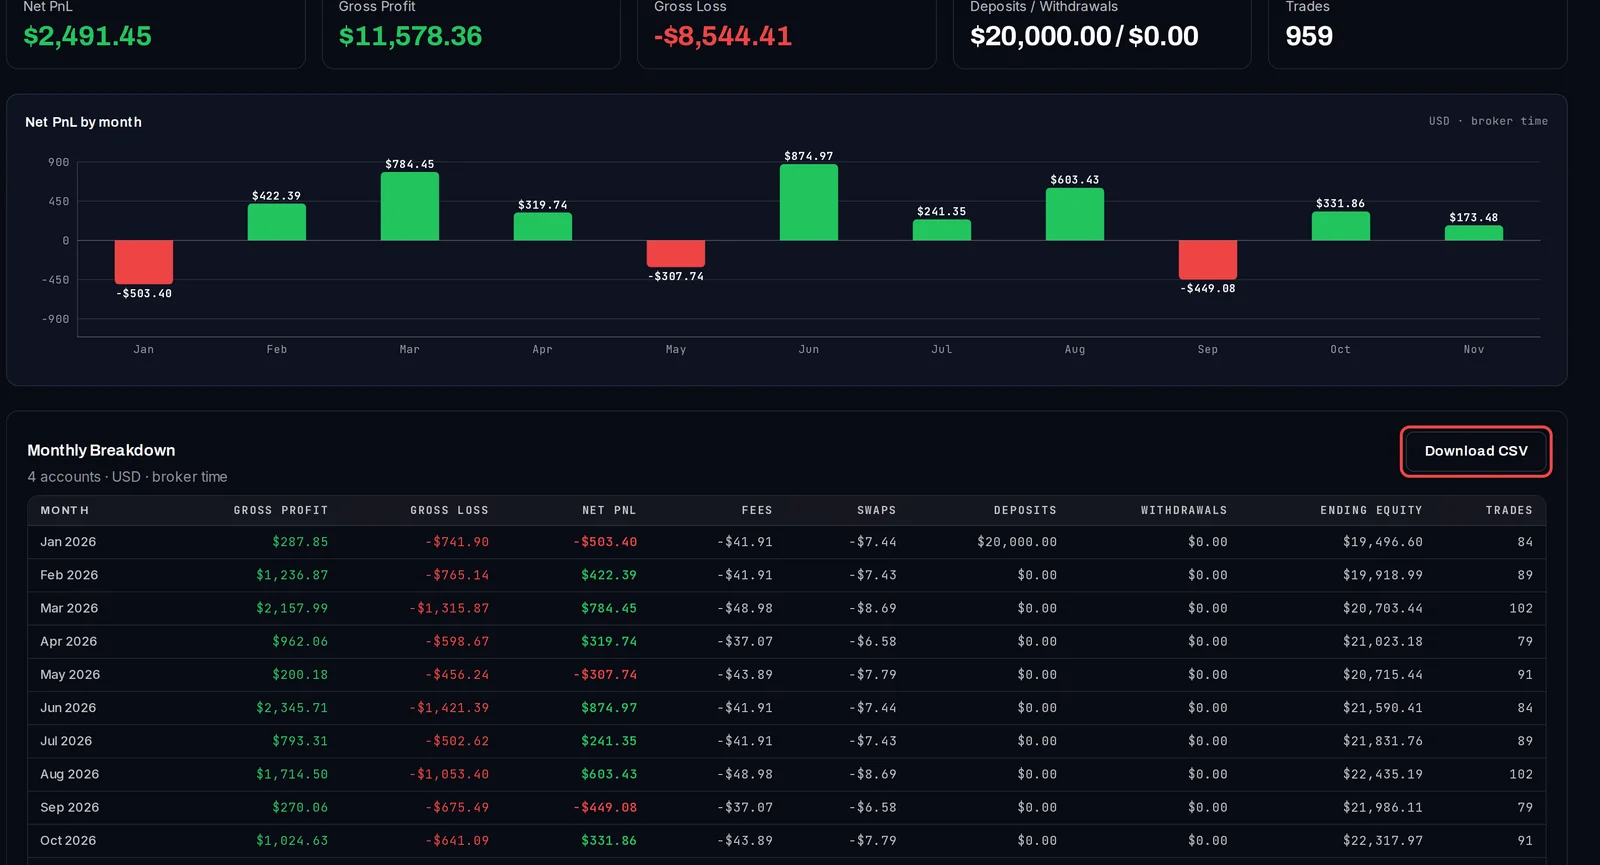
- The totals for the whole range are at the top, and Net PnL by month charts each month.
- The Monthly Breakdown table lists each month: Gross Profit, Gross Loss, Net PnL, Fees, Swaps, Deposits, Withdrawals, Ending Equity and Trades, with a Total row at the bottom.
- Click Download CSV to save it as a file you can open in Excel or Google Sheets.
Good to know
- Each month is cut on the broker's own calendar, the same way as the broker's statement (the table says broker time).
- Accounts in different currencies are not added together. If you pick a mix, the page asks you to choose accounts in one currency, for example with All USD accounts.
- Your Watch List and your own lists have an Open Monthly PnL button. It opens Reports with that list's accounts already picked; then click the Monthly Breakdown tab.