
Knowledge Base
Help Center articles
Find your best hours and days (Breakdown and heatmap)
Does your robot earn its money on Mondays, or lose it in the New York session? The Breakdown and the Profit by Hour & Day heatmap on the Trade Analysis tab show where the results come from.
Plan: every plan.
Group the trades
- Open the account and click the Trade Analysis tab.
- Scroll to Breakdown.
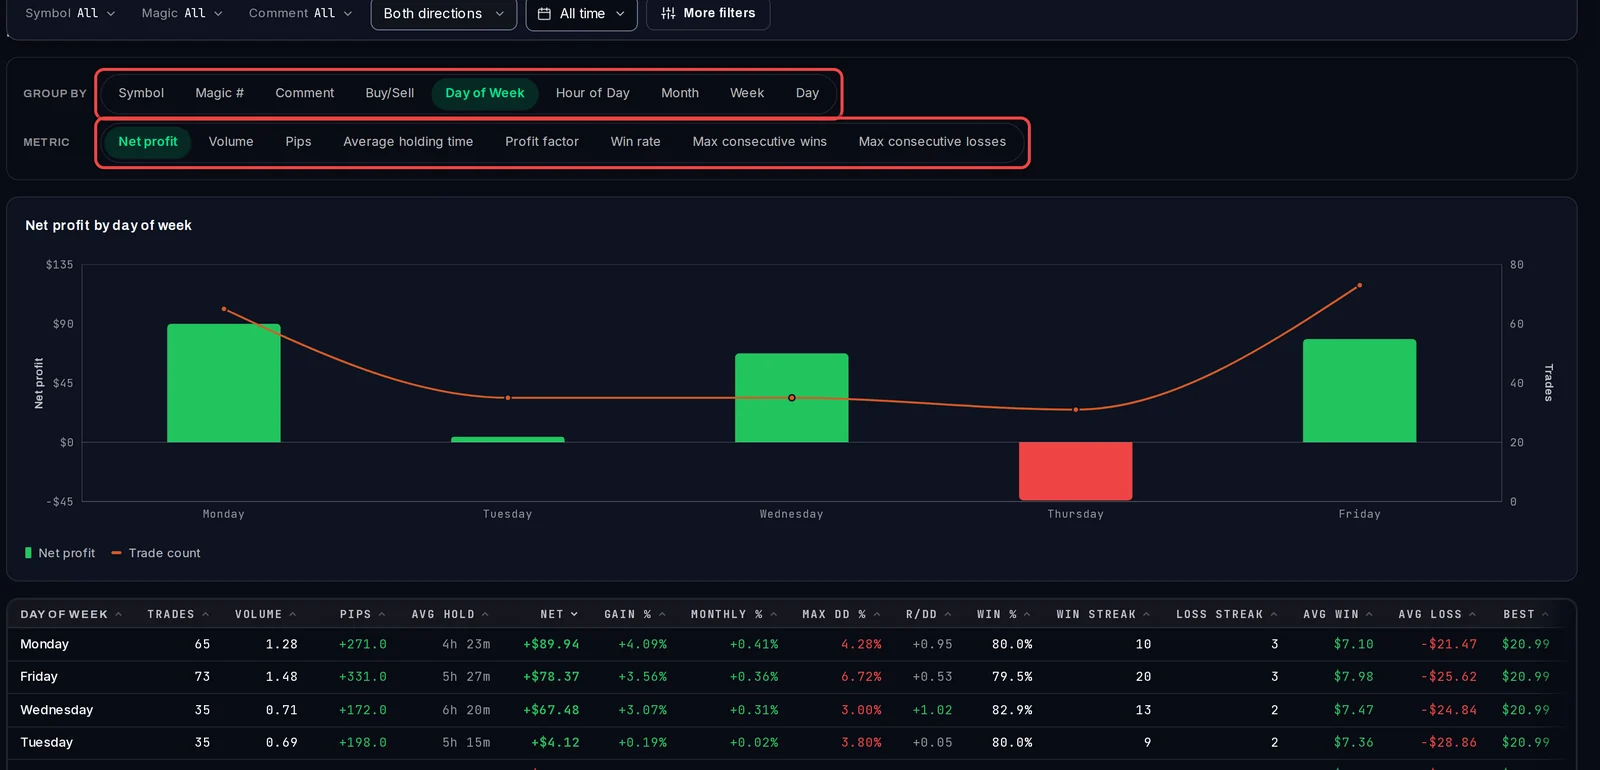
- Under Group by, pick how to split the trades: Symbol, Magic #, Comment, Buy/Sell, Day of Week, Hour of Day, Month, Week or Day.
- Under Metric, pick what the chart shows: Net profit, Volume, Pips, Average holding time, Profit factor (money won divided by money lost), Win rate, or the longest run of wins or losses. The line shows the number of trades in each group.
Drill into one group
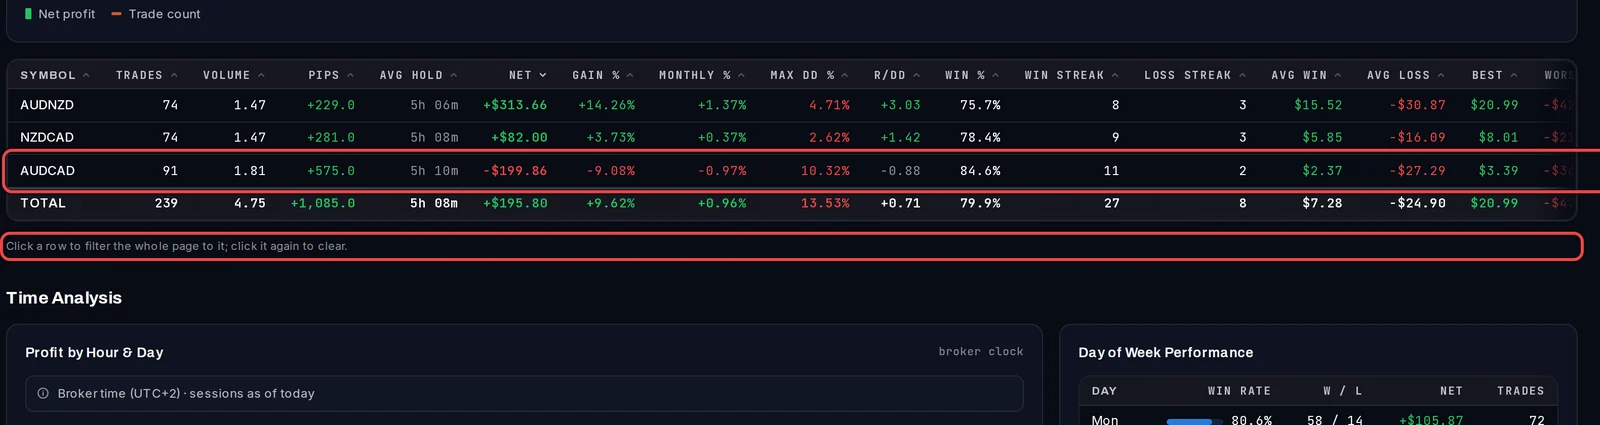
- Under the chart, the table gives every group's trades, profit, gain, drawdown, win rate, average win and loss, best and worst trade, with a total row.
- Click a row, for example a symbol or a month, to filter the whole page to it. Click it again to clear.
Read the heatmap
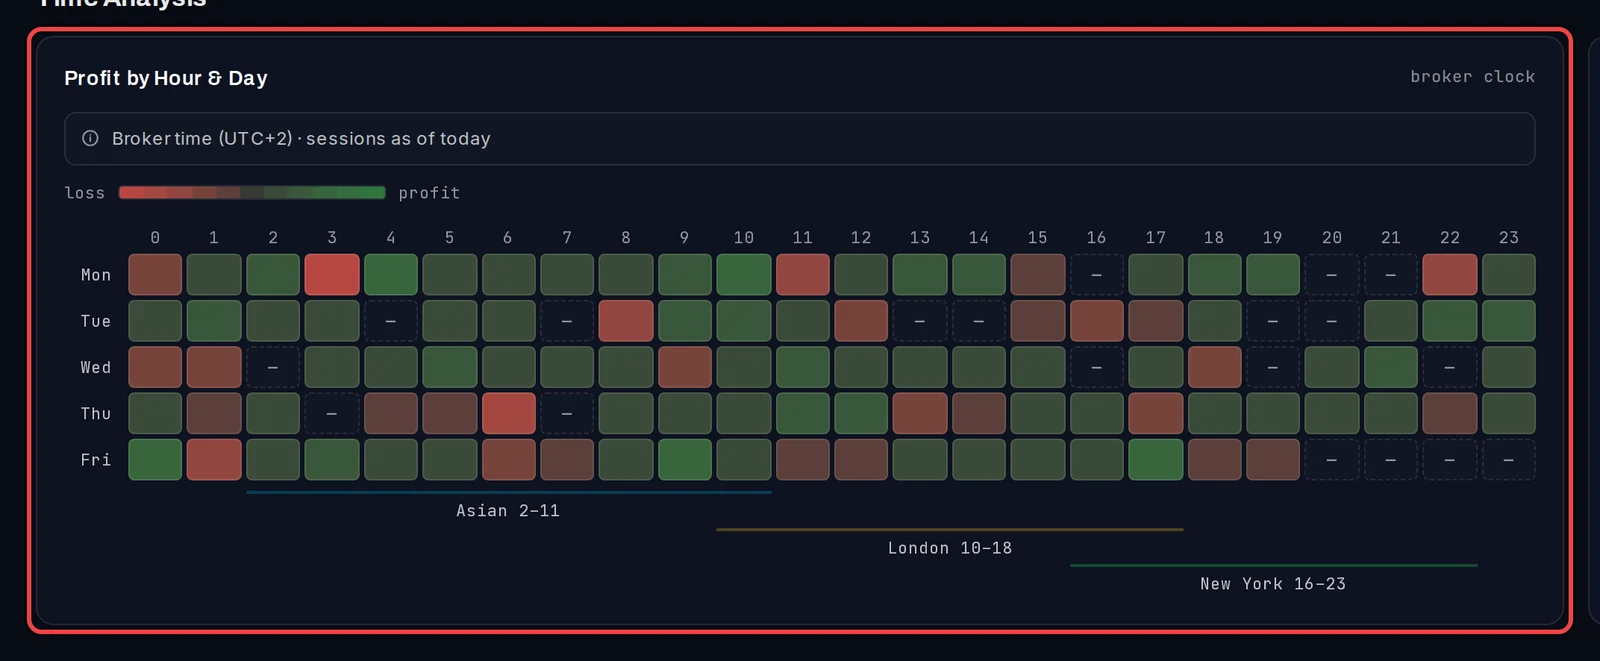
- Scroll to Time Analysis. Profit by Hour & Day has a row per weekday and a column per hour of the broker's clock.
- Green cells made money, red cells lost it; the stronger the colour, the bigger the amount. A dash means no trades.
- Point at a cell to see its profit, number of trades and win rate.
- The bands under the grid mark the Asian, London and New York sessions in broker time.
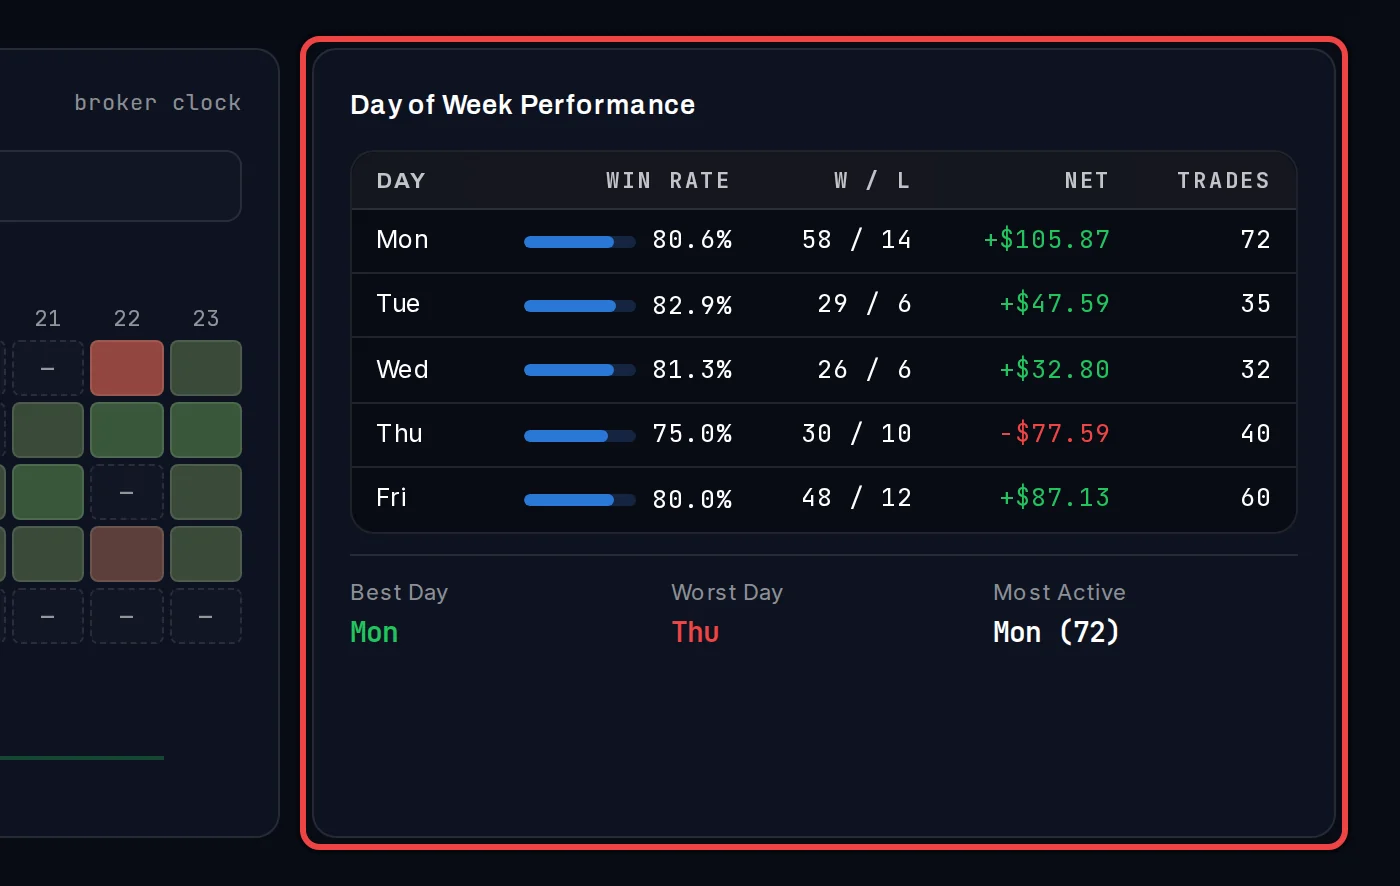
Beside it, Day of Week Performance gives each weekday's win rate, wins and losses, net profit and trades, and names the Best Day, Worst Day and Most Active day.
Good to know
- The Breakdown puts a trade on the day and hour it closed. The heatmap and Day of Week Performance use the day and hour it opened, so their numbers can differ a little.
- The heatmap and Day of Week Performance cover Monday to Friday; trades opened at the weekend are not in them.
- The session bands follow summer and winter time, so they can move by an hour during the year.
- Everything here follows the filter bar: filter to one robot first to see that robot's best hours.