
Knowledge Base
Help Center articles
Compare a backtest with live trading
Is your robot trading live the way it did in the Strategy Tester? The Backtest Comparison tab puts a backtest next to the account's real trades, marks where they part ways and gives a written verdict with recommendations.
Plan: Pro or VIP. The 14 days of Pro every new user starts with include it.
Add the backtest
- Open the account and click the Backtest Comparison tab.
- Under Step 1 — Upload Backtest Report, drop the HTML report you saved from the MetaTrader 4 or 5 Strategy Tester (
.htmor.html) on the Backtest Report card, or click browse. - Optional: click Add Testergraph Report (.csv) to add the tester's balance and equity curve.
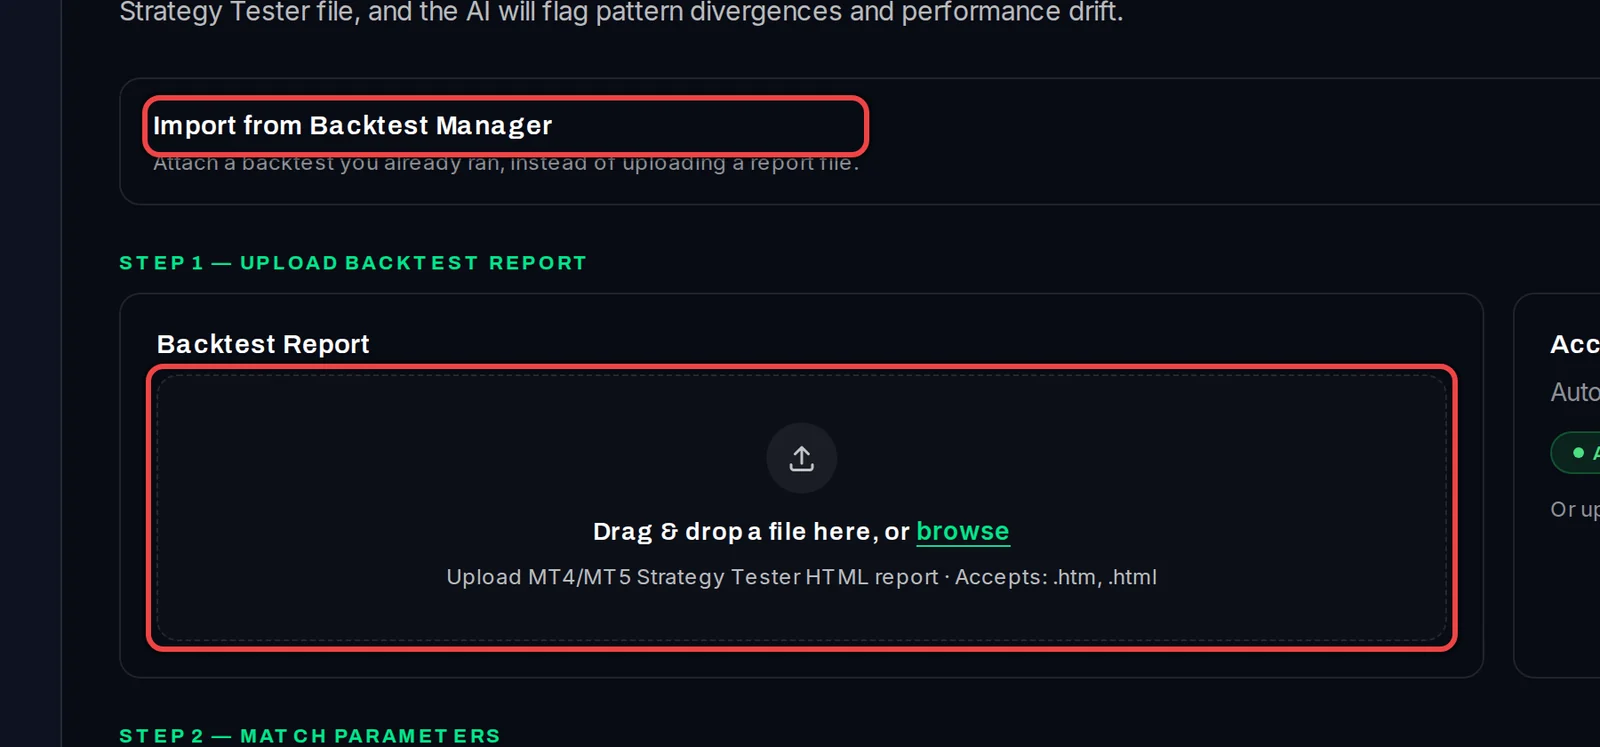
The Account Data card fills itself from the account's tracked trades. Ran the test in the Backtest Manager? Use Import from Backtest Manager above the cards instead (see the related guide).
Match and run
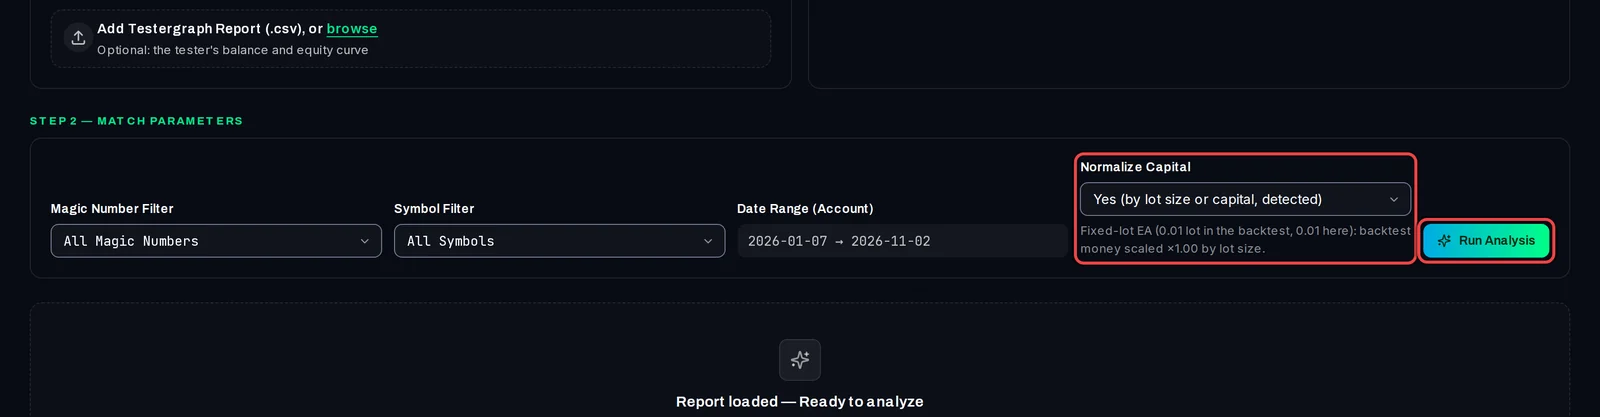
- Under Step 2 — Match Parameters, pick the robot's number in Magic Number Filter and its pair in Symbol Filter if the account runs more than one robot. The magic number is the ID an EA stamps on every trade it opens.
- Leave Normalize Capital on Yes. It scales the backtest's money figures to this account, by lot size for a robot that trades a fixed lot or by starting balance for one that sizes by balance. The line under it says which it used.
- Click Run Analysis.
Read the comparison
- The Health Score shows how closely the account matches its backtest, from 0 to 100, with each figure side by side.
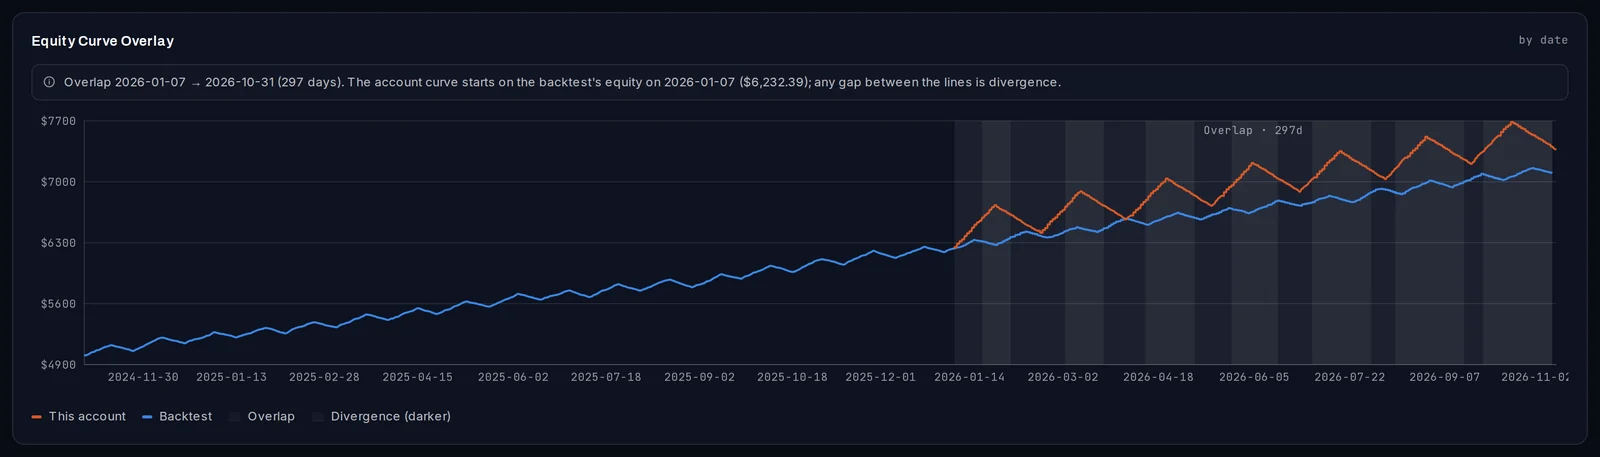
- The Equity Curve Overlay draws both curves on one calendar. The shaded part is the period both cover. Same-Period Comparison below it compares only those days.
- Further down are the checks, the duration and win-rate charts, and at the bottom the written verdict with Recommended Actions.
Open a saved comparison
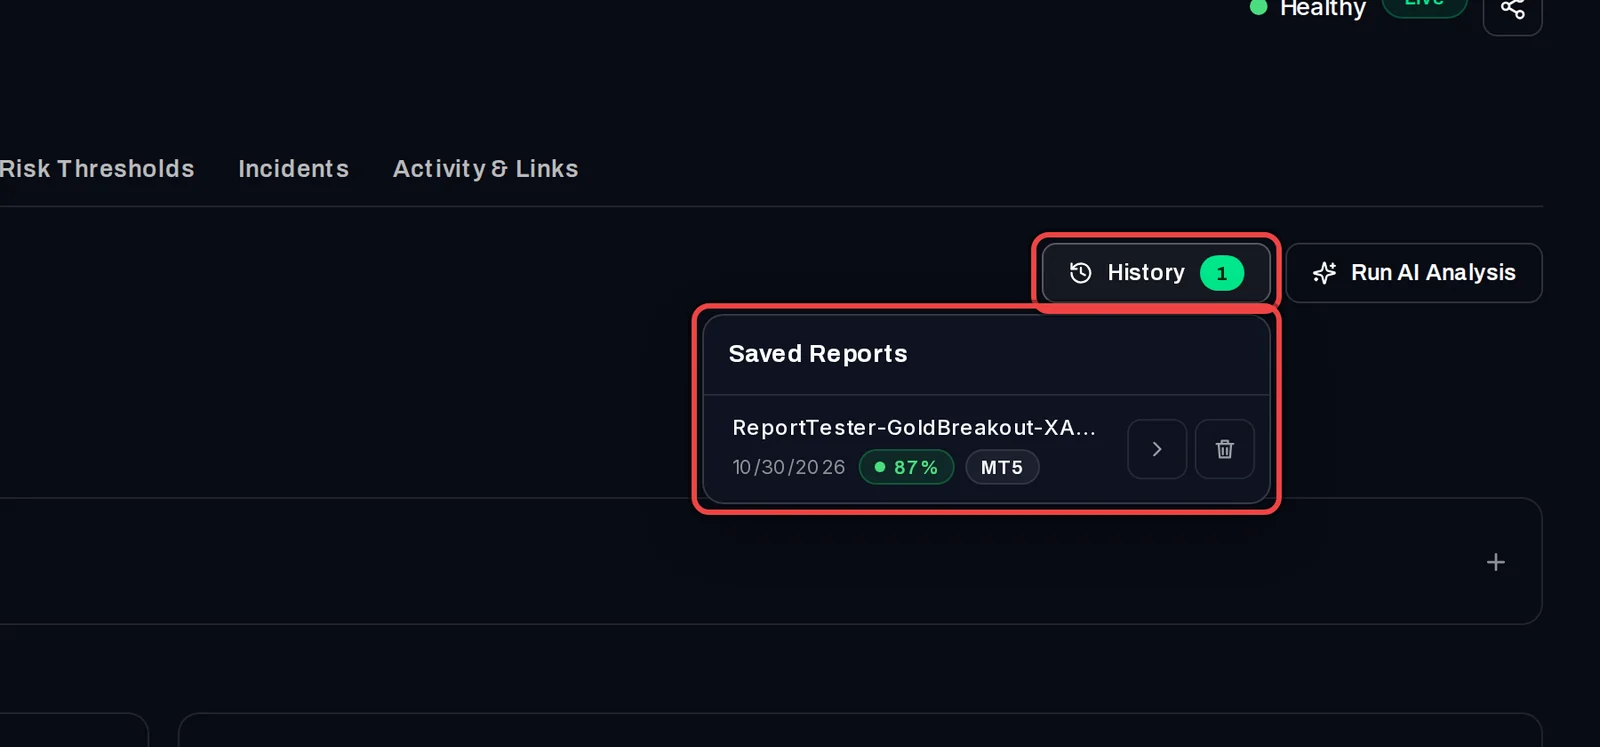
- Every analysis you run is saved. Click History at the top of the tab.
- Under Saved Reports, click a report to load it again, or the bin icon to delete it.
Good to know
- The newest saved report opens by itself when you come back to the tab.
- A short live period is compared with care: the tab tells you how much the figures can be trusted (High, Medium or Low Confidence).
- Deleting a saved report removes the comparison only. Your backtest file and the account's trades are not touched.
- Pro users can add their own OpenAI key in Settings › Plan & Integrations.